SOM cluster: 1149
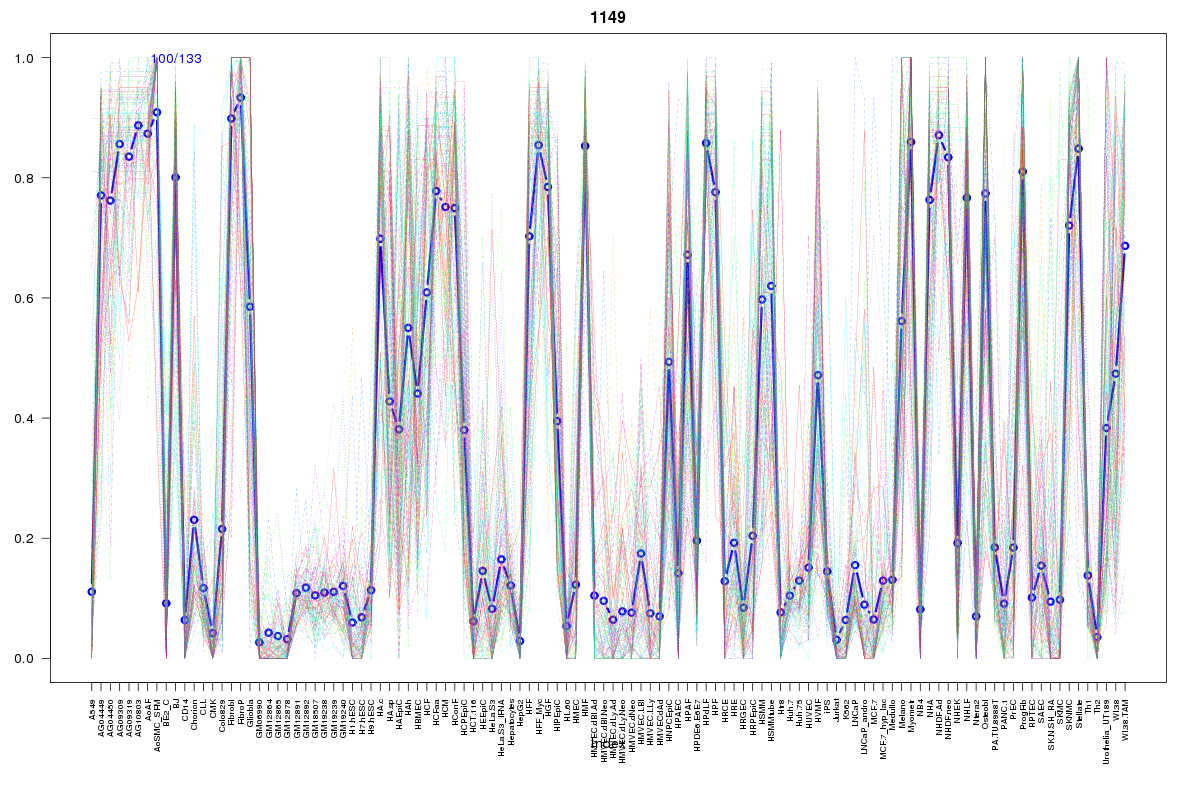
Cluster Hypersensitivity Profile

Genomic Location Trend
These plots show the distribution of the DHS sites surrounding the Transcript Start Site of the nearest gene.
Stats
Number of sites: 133Promoter: 4%
CpG-Island: 2%
Conserved: 49%
Enriched Motifs & Matches
Match Detail: [Jaspar]
|
| ||
|---|---|---|
| Sites: 24/100 | e-val: 0.015 | ||
| Factor | e-val(match) | DB |
| SP1 | 0.00066249 | JASPAR |
| EWSR1-FLI1 | 0.0011425 | JASPAR |
| Pax4 | 0.0032088 | JASPAR |
| Tal1::Gata1 | 0.0069112 | JASPAR |
| TEAD1 | 0.008059 | JASPAR |
|
| ||
| Sites: 36/100 | e-val: 0.037 | ||
| Factor | e-val(match) | DB |
| NFE2L2 | 0.000000003309 | JASPAR |
| AP1 | 0.000000035065 | JASPAR |
| NFE2L1::MafG | 0.038645 | JASPAR |
| Mafb | 0.043105 | JASPAR |
| Pdx1 | 0.061426 | JASPAR |