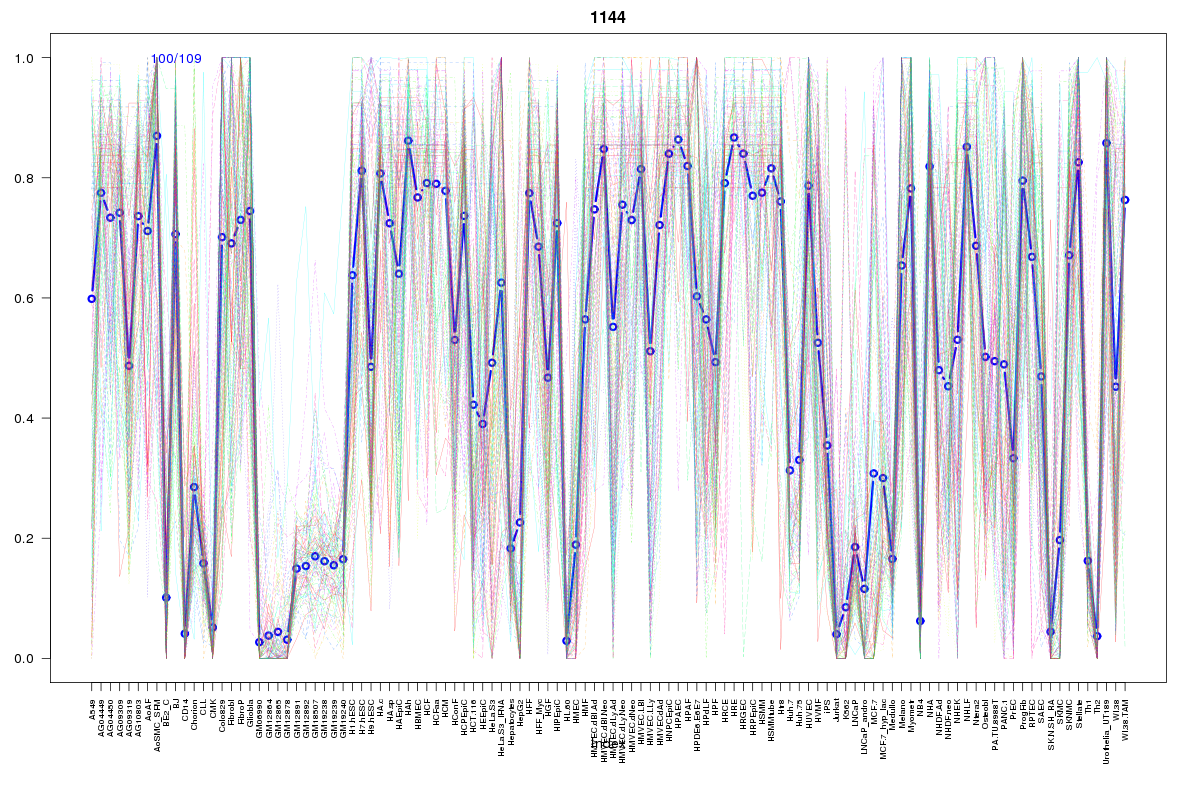
SOM cluster: 1144
Cluster Hypersensitivity Profile

Genomic Location Trend
These plots show the distribution of the DHS sites surrounding the Transcript Start Site of the nearest gene.
Stats
Number of sites: 109Promoter: 4%
CpG-Island: 1%
Conserved: 60%
Enriched Motifs & Matches
Match Detail: [Jaspar]
|
| ||
|---|---|---|
| Sites: 25/100 | e-val: 1.5e-16 | ||
| Factor | e-val(match) | DB |
| TEAD1 | 0.000096962 | JASPAR |
| znf143 | 0.00080473 | JASPAR |
| SPIB | 0.0036108 | JASPAR |
| SPI1 | 0.019198 | JASPAR |
| IRF1 | 0.031623 | JASPAR |
|
| ||
| Sites: 26/100 | e-val: 0.000000027 | ||
| Factor | e-val(match) | DB |
| AP1 | 0.000000000025742 | JASPAR |
| NFE2L2 | 0.0000000068398 | JASPAR |
| PPARG | 0.0025385 | JASPAR |
| NFE2L1::MafG | 0.0047519 | JASPAR |
| RORA_2 | 0.013255 | JASPAR |
|
| ||
| Sites: 42/100 | e-val: 0.0000002 | ||
| Factor | e-val(match) | DB |
| TEAD1 | 0.000020102 | JASPAR |
| EWSR1-FLI1 | 0.0022152 | JASPAR |
| RELA | 0.0030845 | JASPAR |
| NF-kappaB | 0.0061313 | JASPAR |
| RORA_2 | 0.010855 | JASPAR |
BED file downloads
Top 10 Example Regions
| Location | Gene Link | Dist. |
|---|---|---|
| chr10: 15242800-15242950 | PPIAP30 | 45.55 |
| chr10: 15242800-15242950 | FAM171A1 | 45.55 |
| chr10: 15242800-15242950 | NMT2 | 45.55 |
| chr7: 116162460-116162610 | CAV2 | 48.37 |
| chr7: 116162460-116162610 | CAV1 | 48.37 |
| chr7: 116162460-116162610 | AC006159.5 | 48.37 |
| chr1: 43938600-43938750 | PTPRF | 65.89 |
| chr1: 43938600-43938750 | HYI | 65.89 |
| chr1: 43938600-43938750 | SZT2-AS1 | 65.89 |
| chr22: 31640080-31640230 | PATZ1 | 70.17 |