SOM cluster: 1136
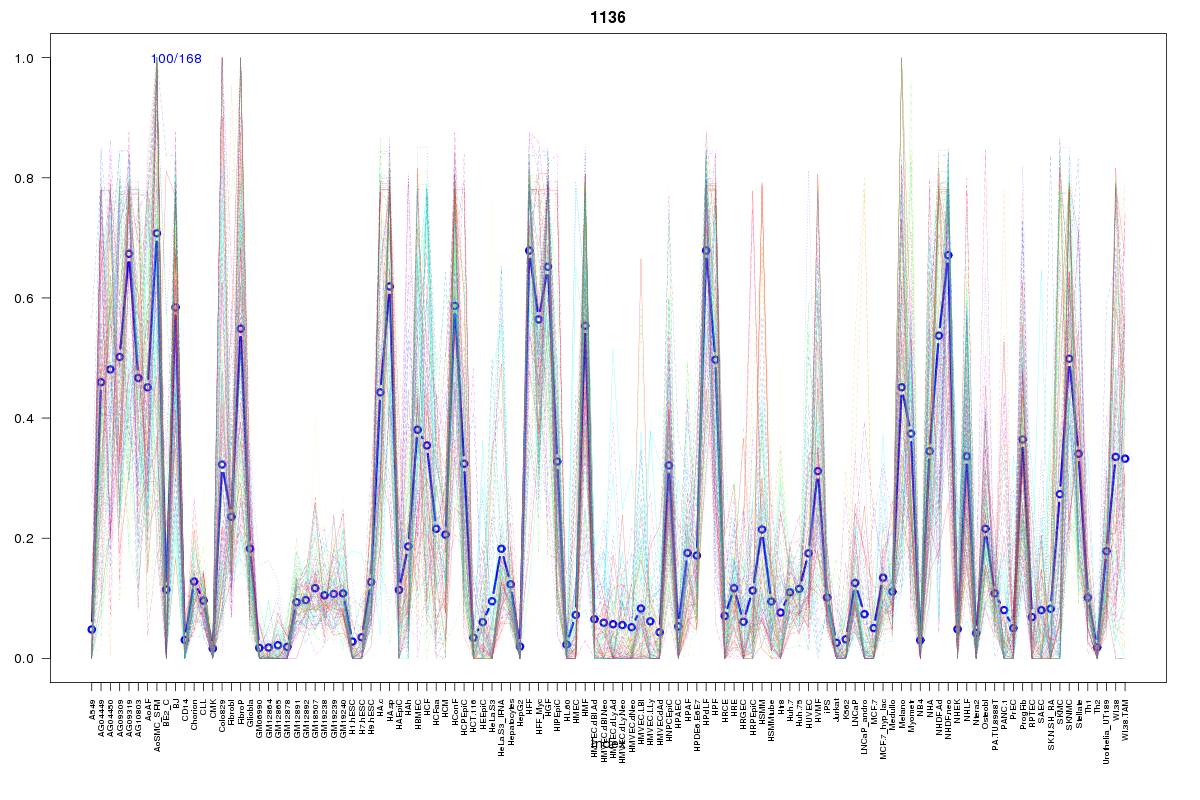
Cluster Hypersensitivity Profile

Genomic Location Trend
These plots show the distribution of the DHS sites surrounding the Transcript Start Site of the nearest gene.
Stats
Number of sites: 168Promoter: 2%
CpG-Island: 0%
Conserved: 59%
Enriched Motifs & Matches
Match Detail: [Jaspar]
|
| ||
|---|---|---|
| Sites: 55/100 | e-val: 0.00011 | ||
| Factor | e-val(match) | DB |
| ARID3A | 0.00060651 | JASPAR |
| Foxq1 | 0.0022393 | JASPAR |
| Lhx3 | 0.0026069 | JASPAR |
| AP1 | 0.0079844 | JASPAR |
| HNF1B | 0.012447 | JASPAR |
|
| ||
| Sites: 19/100 | e-val: 0.0000000017 | ||
| Factor | e-val(match) | DB |
| Prrx2 | 0.00008112 | JASPAR |
| TAL1::TCF3 | 0.00012379 | JASPAR |
| ARID3A | 0.00014784 | JASPAR |
| Nkx2-5 | 0.00022881 | JASPAR |
| HNF1A | 0.0003537 | JASPAR |
BED file downloads
Top 10 Example Regions
| Location | Gene Link | Dist. |
|---|---|---|
| chrX: 117654580-117654730 | WDR44 | 39.13 |
| chrX: 117654580-117654730 | DOCK11 | 39.13 |
| chr3: 29956740-29956890 | RBMS3 | 44.04 |
| chr8: 8621560-8621710 | AC087269.1 | 50.46 |
| chr9: 134969720-134969870 | NTNG2 | 50.56 |
| chr2: 158731520-158731670 | ACVR1 | 54.38 |
| chrX: 65855320-65855470 | EDA2R | 61.91 |
| chr1: 219965780-219965930 | SLC30A10 | 63.49 |
| chr8: 127930080-127930230 | PCAT1 | 66.25 |
| chr18: 42596540-42596690 | SETBP1 | 67.74 |