SOM cluster: 1128
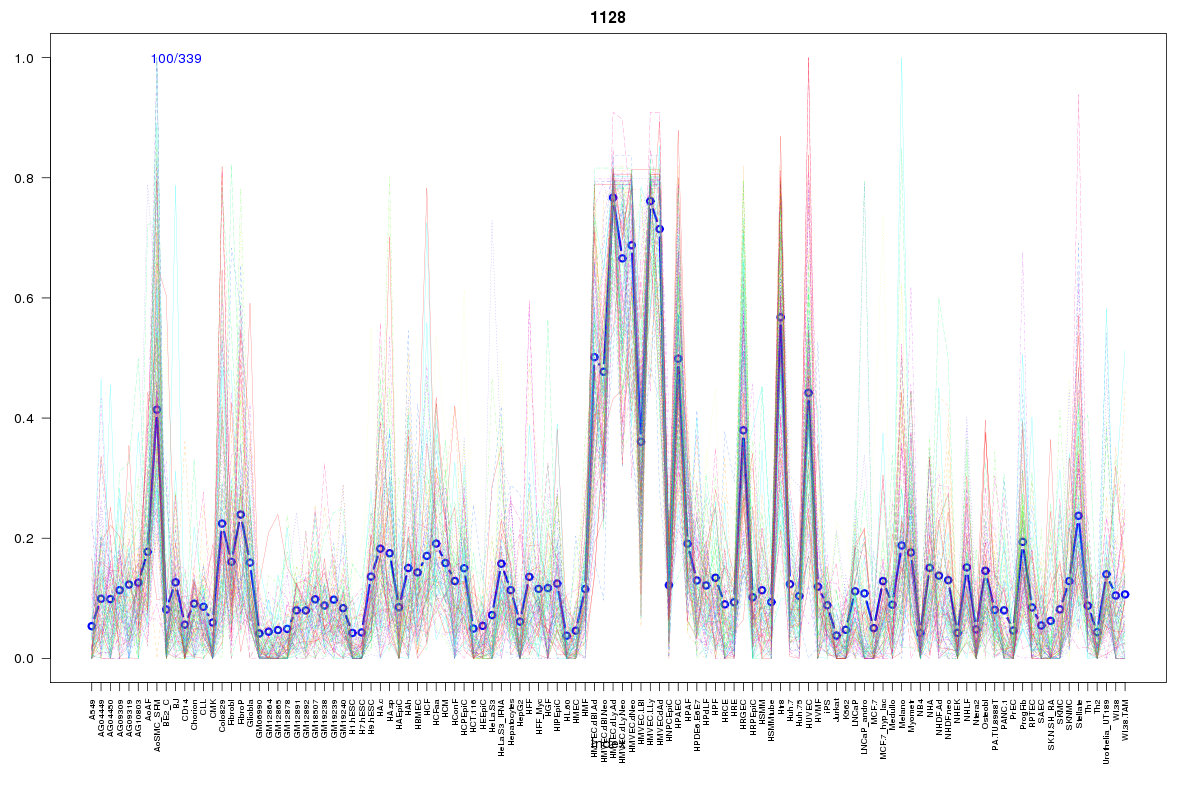
Cluster Hypersensitivity Profile

Genomic Location Trend
These plots show the distribution of the DHS sites surrounding the Transcript Start Site of the nearest gene.
Stats
Number of sites: 339Promoter: 3%
CpG-Island: 0%
Conserved: 52%
Enriched Motifs & Matches
Match Detail: [Jaspar]
|
| ||
|---|---|---|
| Sites: 45/100 | e-val: 5.2e-16 | ||
| Factor | e-val(match) | DB |
| Foxd3 | 0.00000028831 | JASPAR |
| Foxq1 | 0.000058936 | JASPAR |
| SRY | 0.00015531 | JASPAR |
| Sox5 | 0.0006219 | JASPAR |
| Pax4 | 0.00078784 | JASPAR |
|
| ||
| Sites: 23/100 | e-val: 0.12 | ||
| Factor | e-val(match) | DB |
| NFATC2 | 0.0000045824 | JASPAR |
| Pax4 | 0.0028791 | JASPAR |
| FEV | 0.006015 | JASPAR |
| Pou5f1 | 0.018739 | JASPAR |
| IRF1 | 0.02419 | JASPAR |
BED file downloads
Top 10 Example Regions
| Location | Gene Link | Dist. |
|---|---|---|
| chr10: 11372740-11372890 | CELF2-AS1 | 31.34 |
| chr8: 69095680-69095830 | PREX2 | 34.82 |
| chr3: 34249340-34249490 | AC018359.1 | 40.99 |
| chr1: 156131620-156131770 | RAB25 | 43.92 |
| chr17: 58247225-58247375 | CA4 | 44.74 |
| chr19: 54982240-54982390 | LENG8 | 45.49 |
| chr19: 54982240-54982390 | LENG9 | 45.49 |
| chr13: 103382180-103382330 | ERCC5 | 47.86 |
| chr13: 103382180-103382330 | TPP2 | 47.86 |
| chr3: 29554840-29554990 | RBMS3 | 48.07 |