SOM cluster: 1125
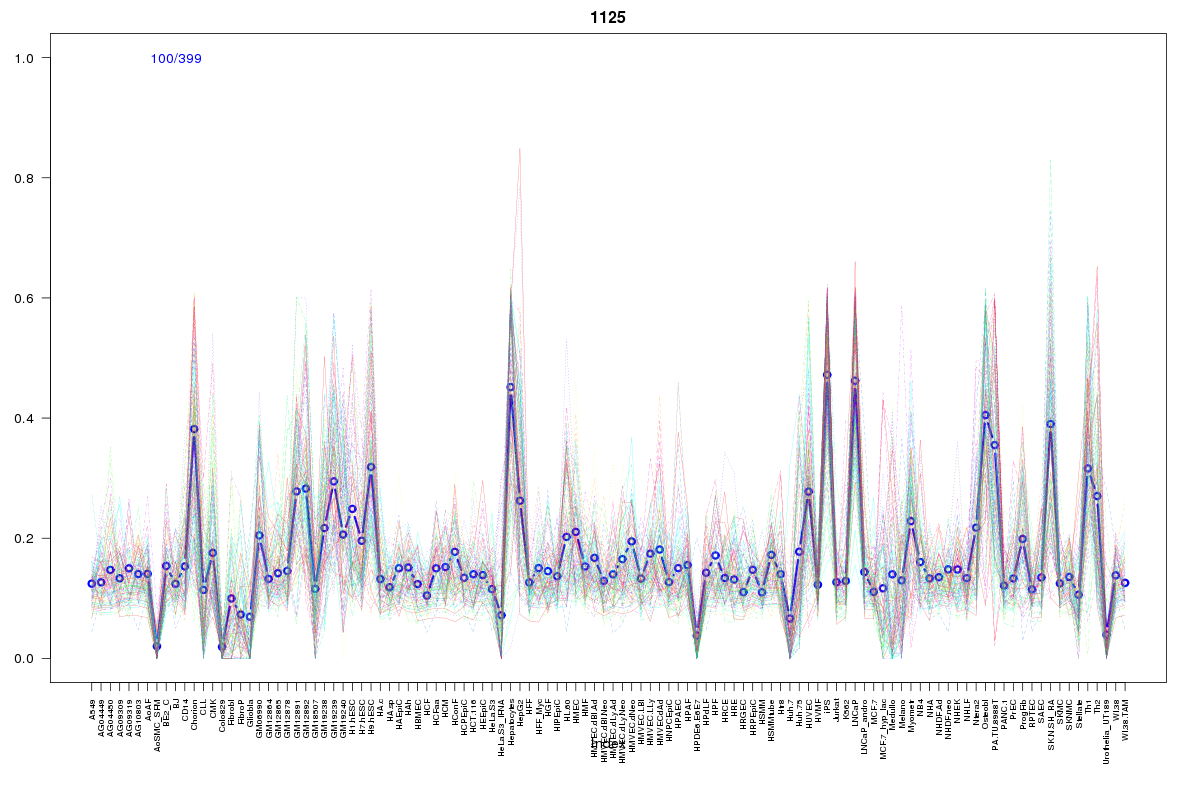
Cluster Hypersensitivity Profile

Genomic Location Trend
These plots show the distribution of the DHS sites surrounding the Transcript Start Site of the nearest gene.
Stats
Number of sites: 399Promoter: 19%
CpG-Island: 61%
Conserved: 49%
Enriched Motifs & Matches
Match Detail: [Jaspar]
|
| ||
|---|---|---|
| Sites: 89/100 | e-val: 0 | ||
| Factor | e-val(match) | DB |
| SP1 | 0.00000024601 | JASPAR |
| TFAP2A | 0.000030466 | JASPAR |
| Egr1 | 0.0018518 | JASPAR |
| PLAG1 | 0.0030458 | JASPAR |
| RREB1 | 0.015004 | JASPAR |
|
| ||
| Sites: 64/100 | e-val: 0.000000000000026 | ||
| Factor | e-val(match) | DB |
| PLAG1 | 0.000017104 | JASPAR |
| TFAP2A | 0.000021656 | JASPAR |
| SP1 | 0.000043255 | JASPAR |
| Klf4 | 0.023163 | JASPAR |
| Zfx | 0.027022 | JASPAR |
BED file downloads
Top 10 Example Regions
| Location | Gene Link | Dist. |
|---|---|---|
| chr5: 132149645-132149795 | LEAP2 | 42.16 |
| chr5: 176289765-176289915 | UNC5A | 46.72 |
| chr12: 34261025-34261175 | TUBB8P4 | 47.12 |
| chr12: 34261025-34261175 | RP11-313F23.4 | 47.12 |
| chr16: 325285-325435 | RGS11 | 51.91 |
| chr16: 325285-325435 | ITFG3 | 51.91 |
| chr1: 1004985-1005135 | RP11-465B22.5 | 56.25 |
| chr16: 850445-850595 | LMF1 | 56.85 |
| chr16: 850445-850595 | MSLNL | 56.85 |
| chr10: 13751585-13751735 | RP11-353M9.1 | 60.46 |