SOM cluster: 1119
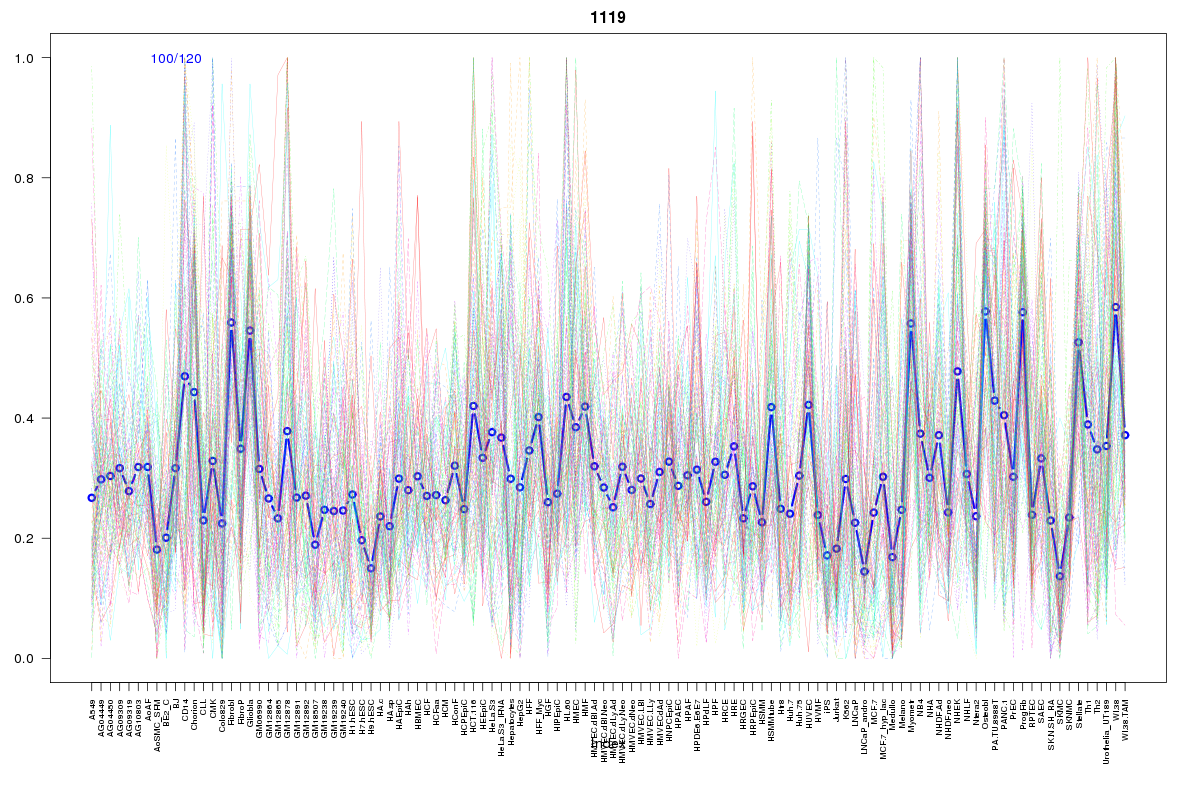
Cluster Hypersensitivity Profile

Genomic Location Trend
These plots show the distribution of the DHS sites surrounding the Transcript Start Site of the nearest gene.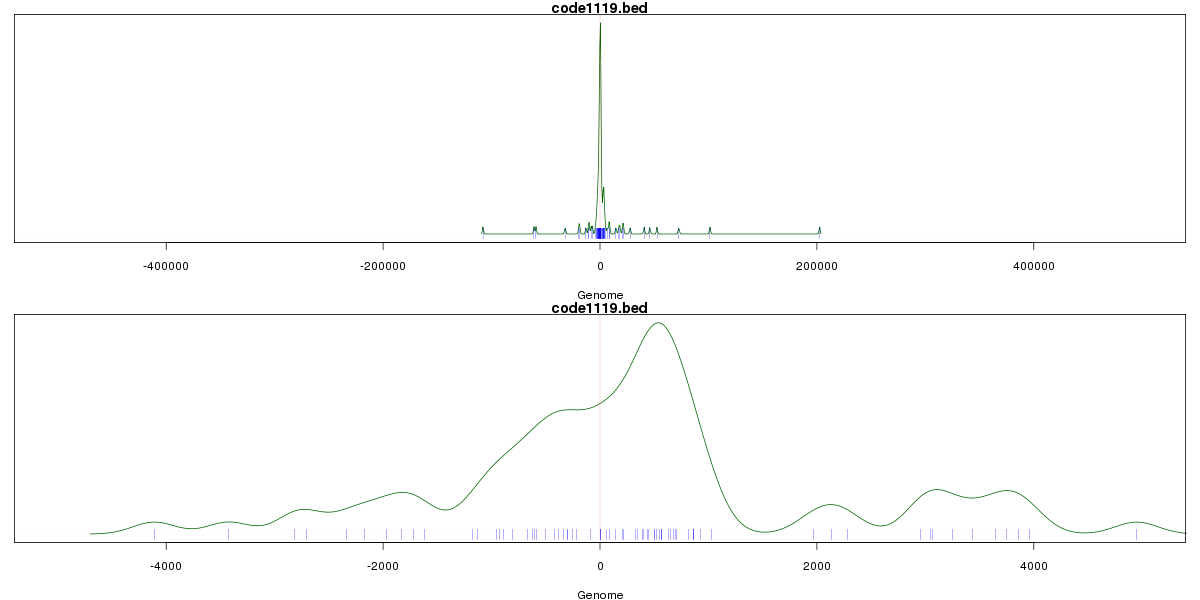
Stats
Number of sites: 120Promoter: 32%
CpG-Island: 24%
Conserved: 39%
Enriched Motifs & Matches
Match Detail: [Jaspar]
|
| ||
|---|---|---|
| Sites: 47/100 | e-val: 7.1e-18 | ||
| Factor | e-val(match) | DB |
| AP1 | 0.00000026472 | JASPAR |
| NFE2L2 | 0.000023646 | JASPAR |
| PPARG | 0.0017703 | JASPAR |
| Spz1 | 0.010964 | JASPAR |
| T | 0.012558 | JASPAR |
BED file downloads
Top 10 Example Regions
| Location | Gene Link | Dist. |
|---|---|---|
| chr1: 202857460-202857610 | Y_RNA | 45.18 |
| chr1: 202857460-202857610 | SLC25A39P1 | 45.18 |
| chr1: 202857460-202857610 | RABIF | 45.18 |
| chr3: 187459400-187459550 | BCL6 | 51.07 |
| chr17: 1391760-1391910 | CRK | 52.07 |
| chr17: 1391760-1391910 | MYO1C | 52.07 |
| chr16: 29479200-29479350 | SNX29P2 | 57.07 |
| chr1: 45272720-45272870 | PLK3 | 59.46 |
| chr17: 40264200-40264350 | DHX58 | 59.64 |
| chr17: 76338525-76338675 | RN7SL236P | 60.48 |