SOM cluster: 1103
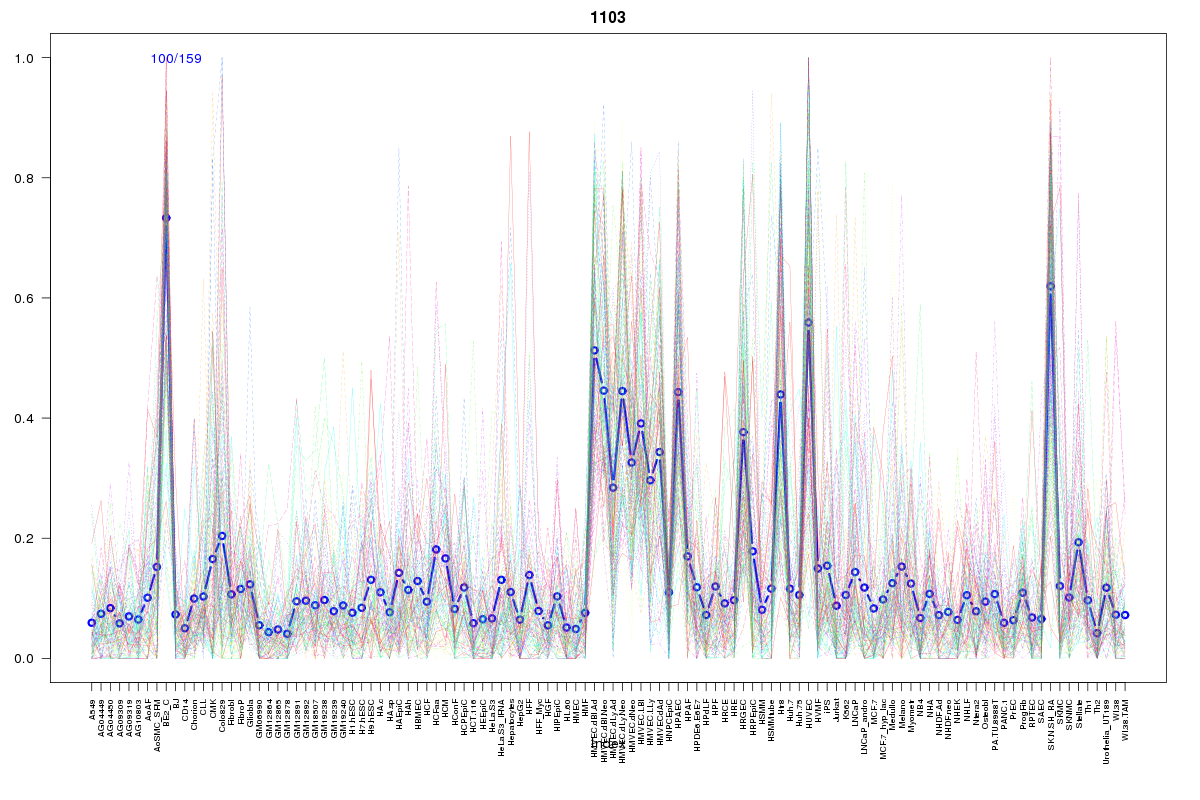
Cluster Hypersensitivity Profile

Genomic Location Trend
These plots show the distribution of the DHS sites surrounding the Transcript Start Site of the nearest gene.
Stats
Number of sites: 159Promoter: 1%
CpG-Island: 3%
Conserved: 52%
Enriched Motifs & Matches
Match Detail: [Jaspar]
|
| ||
|---|---|---|
| Sites: 45/100 | e-val: 0.00000006 | ||
| Factor | e-val(match) | DB |
| FEV | 0.0000000005845 | JASPAR |
| Stat3 | 0.00000029233 | JASPAR |
| SPIB | 0.000009118 | JASPAR |
| ELF5 | 0.000013862 | JASPAR |
| SPI1 | 0.000054017 | JASPAR |
BED file downloads
Top 10 Example Regions
| Location | Gene Link | Dist. |
|---|---|---|
| chr12: 6264300-6264450 | VWF | 56.47 |
| chr4: 120155040-120155190 | MYOZ2 | 60.89 |
| chr3: 7672760-7672910 | GRM7 | 62.43 |
| chr10: 76831000-76831150 | DUSP13 | 67.24 |
| chr1: 7705640-7705790 | CAMTA1 | 67.71 |
| chr22: 28431180-28431330 | TTC28 | 69.83 |
| chr13: 111085520-111085670 | RAB20 | 73.03 |
| chr13: 33767720-33767870 | STARD13-AS | 74.45 |
| chr22: 25206440-25206590 | SGSM1 | 78.87 |
| chr22: 25206440-25206590 | CRIP1P4 | 78.87 |