SOM cluster: 1101
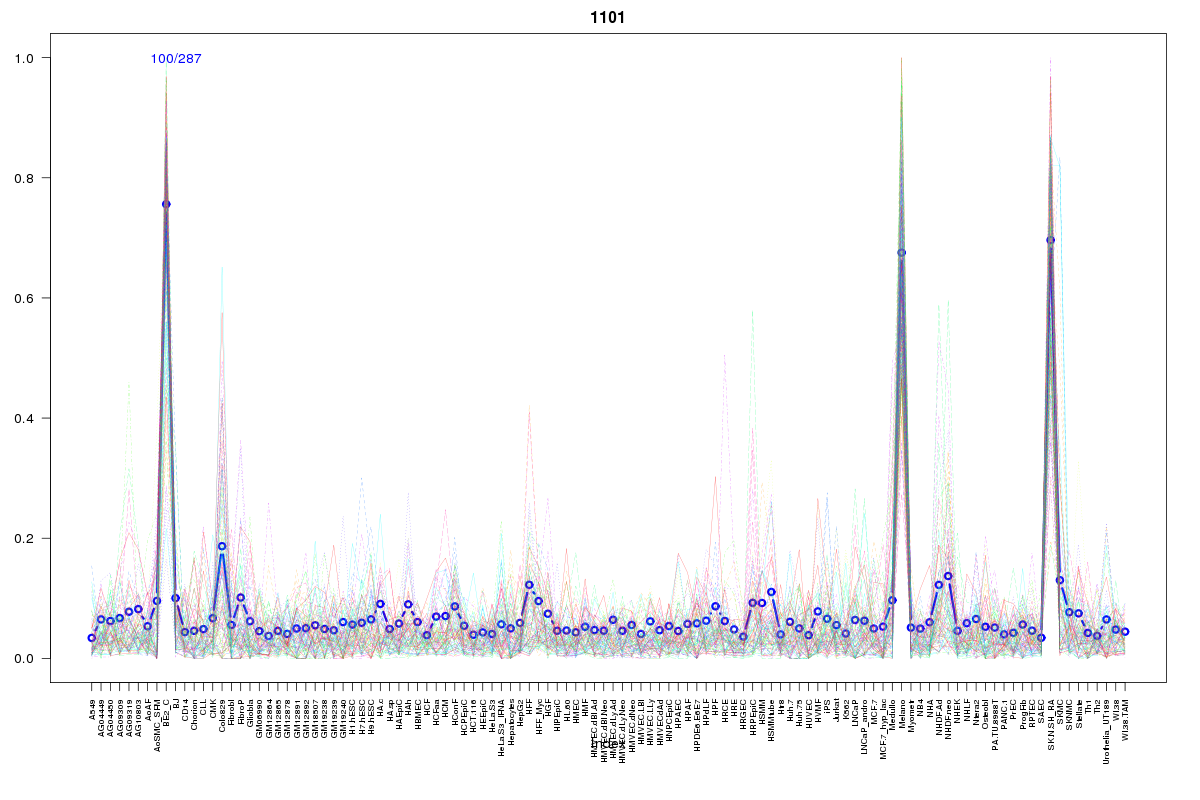
Cluster Hypersensitivity Profile

Genomic Location Trend
These plots show the distribution of the DHS sites surrounding the Transcript Start Site of the nearest gene.
Stats
Number of sites: 287Promoter: 1%
CpG-Island: 0%
Conserved: 65%
Enriched Motifs & Matches
Match Detail: [Jaspar]
|
| ||
|---|---|---|
| Sites: 23/100 | e-val: 0.000082 | ||
| Factor | e-val(match) | DB |
| Myf | 0.00000024127 | JASPAR |
| NHLH1 | 0.0000078899 | JASPAR |
| TAL1::TCF3 | 0.0030263 | JASPAR |
| Myb | 0.0042757 | JASPAR |
| Zfx | 0.0085384 | JASPAR |
BED file downloads
Top 10 Example Regions
| Location | Gene Link | Dist. |
|---|---|---|
| chr13: 102848560-102848710 | FGF14-IT1 | 39.35 |
| chr13: 102848560-102848710 | RPL39P29 | 39.35 |
| chr4: 3019340-3019490 | NOP14 | 45.8 |
| chr4: 3019340-3019490 | MFSD10 | 45.8 |
| chr3: 127365640-127365790 | PODXL2 | 48.75 |
| chrX: 18787980-18788130 | PPEF1 | 60.06 |
| chr16: 88166940-88167090 | RP11-863P13.4 | 61.04 |
| chr14: 32896340-32896490 | AKAP6 | 61.16 |
| chr3: 133674860-133675010 | SLCO2A1 | 62.63 |
| chr2: 25207860-25208010 | DNAJC27 | 67.77 |