SOM cluster: 1087
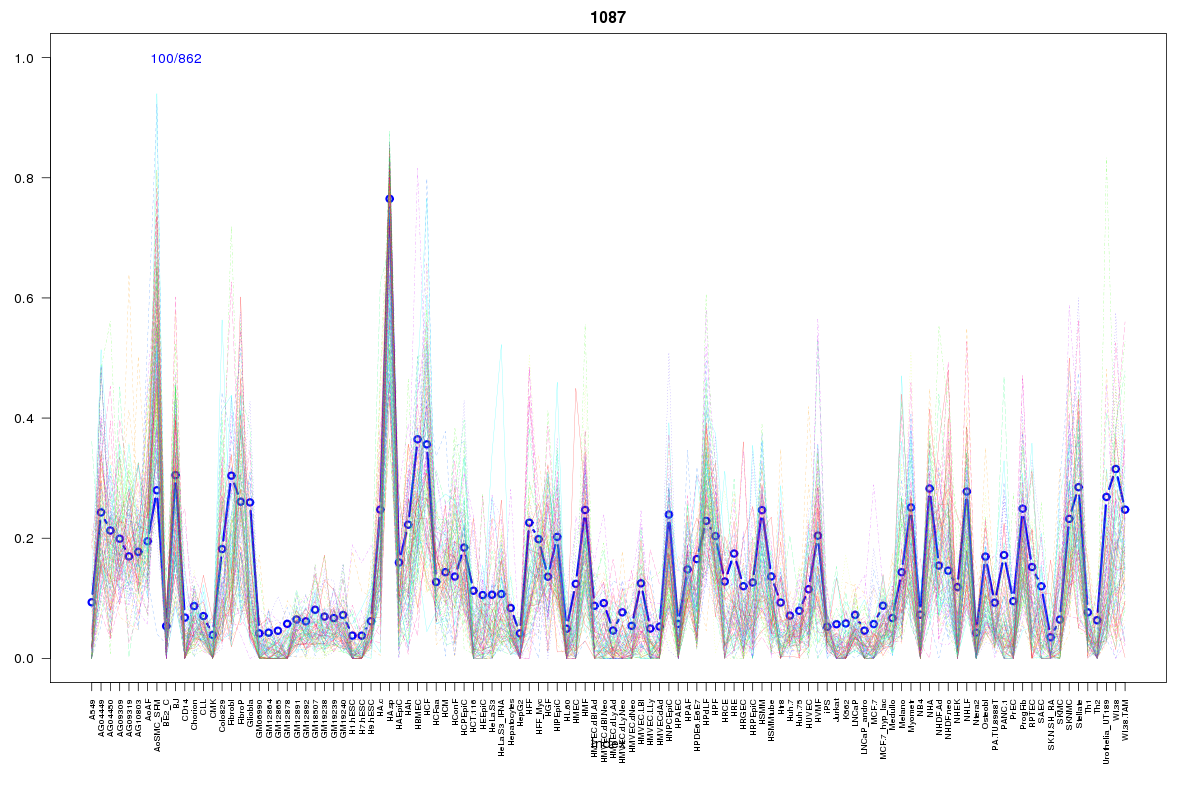
Cluster Hypersensitivity Profile

Genomic Location Trend
These plots show the distribution of the DHS sites surrounding the Transcript Start Site of the nearest gene.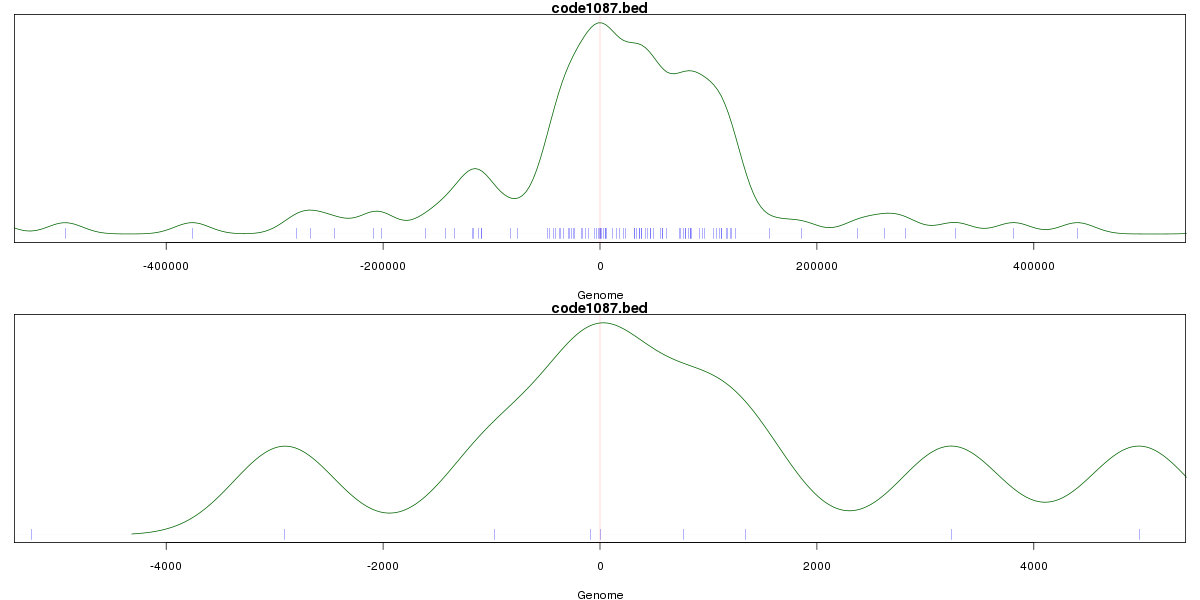
Stats
Number of sites: 862Promoter: 3%
CpG-Island: 0%
Conserved: 40%
Enriched Motifs & Matches
Match Detail: [Jaspar]
|
| ||
|---|---|---|
| Sites: 68/100 | e-val: 1e-21 | ||
| Factor | e-val(match) | DB |
| ARID3A | 0.00042492 | JASPAR |
| Lhx3 | 0.00086627 | JASPAR |
| Foxd3 | 0.0045543 | JASPAR |
| MEF2A | 0.011694 | JASPAR |
| Foxq1 | 0.011943 | JASPAR |
BED file downloads
Top 10 Example Regions
| Location | Gene Link | Dist. |
|---|---|---|
| chr1: 209916365-209916515 | G0S2 | 32.5 |
| chr1: 209916365-209916515 | IRF6 | 32.5 |
| chr12: 8147680-8147830 | FOXJ2 | 40.09 |
| chr12: 8147680-8147830 | RP11-69M1.4 | 40.09 |
| chr11: 3191245-3191395 | OSBPL5 | 45.44 |
| chr11: 3191245-3191395 | MRGPRG | 45.44 |
| chr11: 3191245-3191395 | AC108448.3 | 45.44 |
| chr8: 123868005-123868155 | AC016405.1 | 47.01 |
| chr11: 121968420-121968570 | BLID | 49.36 |
| chr11: 121968420-121968570 | MIR125B1 | 49.36 |