SOM cluster: 1073
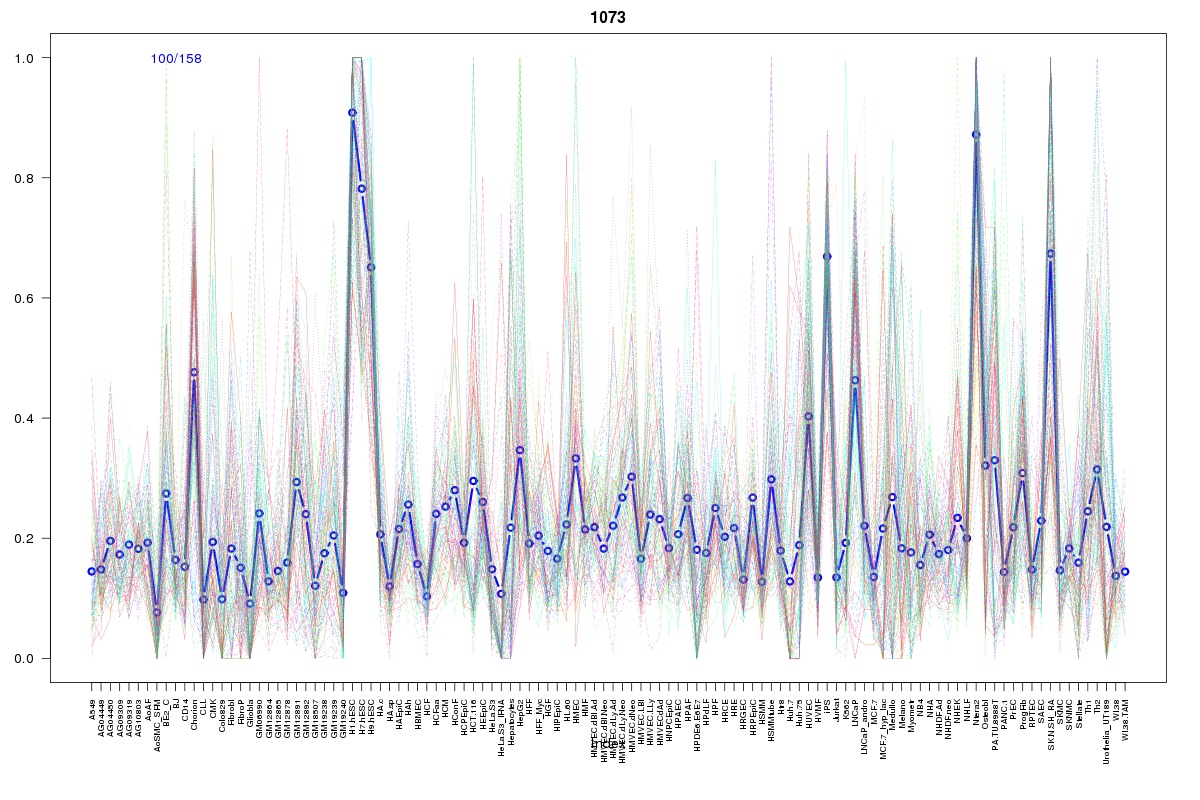
Cluster Hypersensitivity Profile

Genomic Location Trend
These plots show the distribution of the DHS sites surrounding the Transcript Start Site of the nearest gene.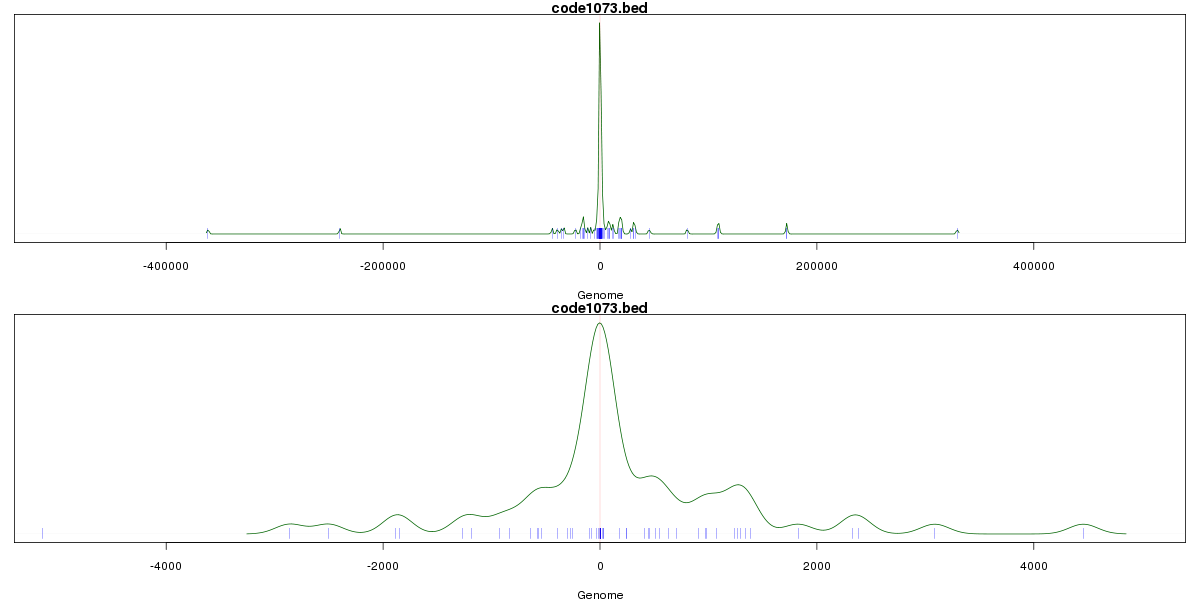
Stats
Number of sites: 158Promoter: 33%
CpG-Island: 92%
Conserved: 86%
Enriched Motifs & Matches
Match Detail: [Jaspar]
|
| ||
|---|---|---|
| Sites: 98/100 | e-val: 0 | ||
| Factor | e-val(match) | DB |
| SP1 | 0.00000000044887 | JASPAR |
| Klf4 | 0.0000041649 | JASPAR |
| Egr1 | 0.000022115 | JASPAR |
| TFAP2A | 0.00063106 | JASPAR |
| INSM1 | 0.016999 | JASPAR |
|
| ||
| Sites: 94/100 | e-val: 3.59994e-41 | ||
| Factor | e-val(match) | DB |
| SP1 | 0.0000048331 | JASPAR |
| TFAP2A | 0.0036343 | JASPAR |
| REST | 0.0044546 | JASPAR |
| NHLH1 | 0.015465 | JASPAR |
| Egr1 | 0.041456 | JASPAR |
|
| ||
| Sites: 57/100 | e-val: 0.000000000014 | ||
| Factor | e-val(match) | DB |
| REST | 0.0000013805 | JASPAR |
| SP1 | 0.0071978 | JASPAR |
| NHLH1 | 0.0079581 | JASPAR |
| TFAP2A | 0.0091813 | JASPAR |
| ZEB1 | 0.016349 | JASPAR |
BED file downloads
Top 10 Example Regions
| Location | Gene Link | Dist. |
|---|---|---|
| chr1: 77333885-77334035 | ST6GALNAC5 | 46.85 |
| chr6: 118228145-118228295 | SLC35F1 | 54.61 |
| chr17: 2626900-2627050 | RAP1GAP2 | 56.13 |
| chr1: 242687665-242687815 | PLD5 | 56.25 |
| chr1: 18902240-18902390 | RP1-8B22.1 | 59.18 |
| chr19: 12936725-12936875 | JUNB | 60.76 |
| chr19: 12936725-12936875 | MAST1 | 60.76 |
| chr11: 64410885-64411035 | NRXN2 | 63.2 |
| chrX: 68723660-68723810 | FAM155B | 63.65 |
| chr7: 20817720-20817870 | SP8 | 65.12 |