SOM cluster: 1069
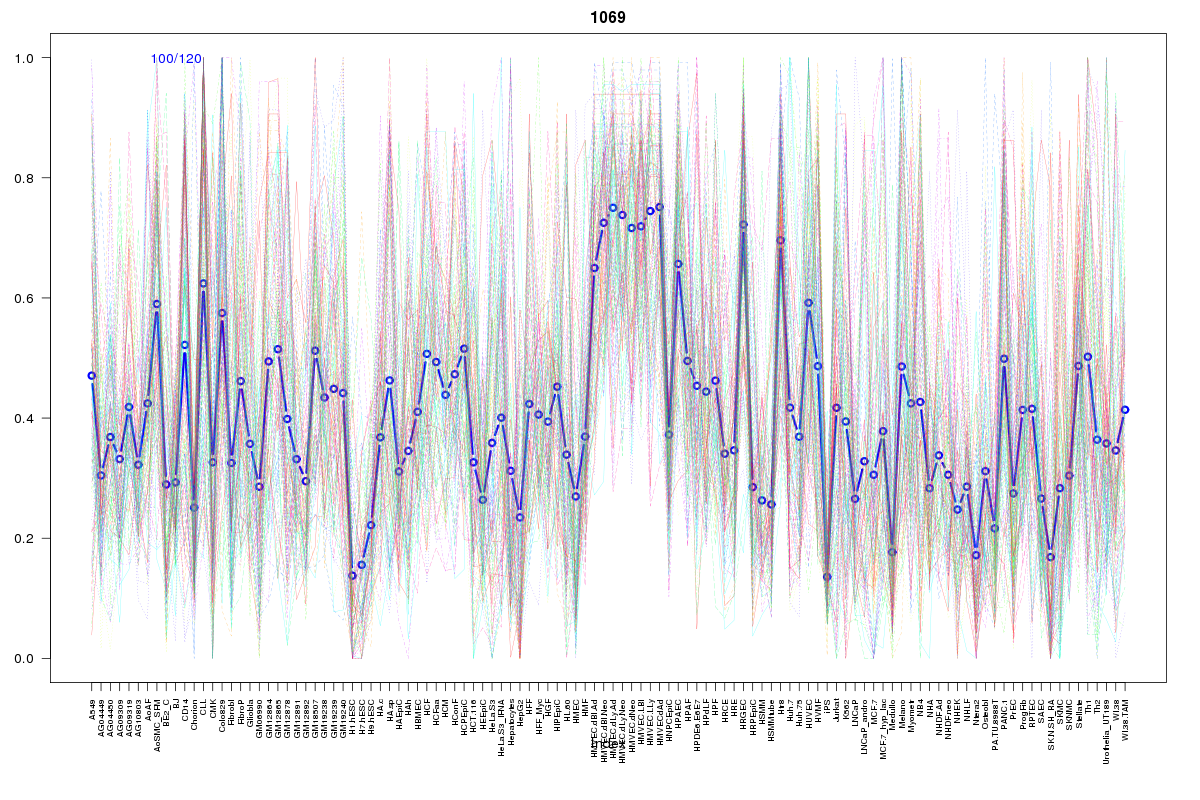
Cluster Hypersensitivity Profile

Genomic Location Trend
These plots show the distribution of the DHS sites surrounding the Transcript Start Site of the nearest gene.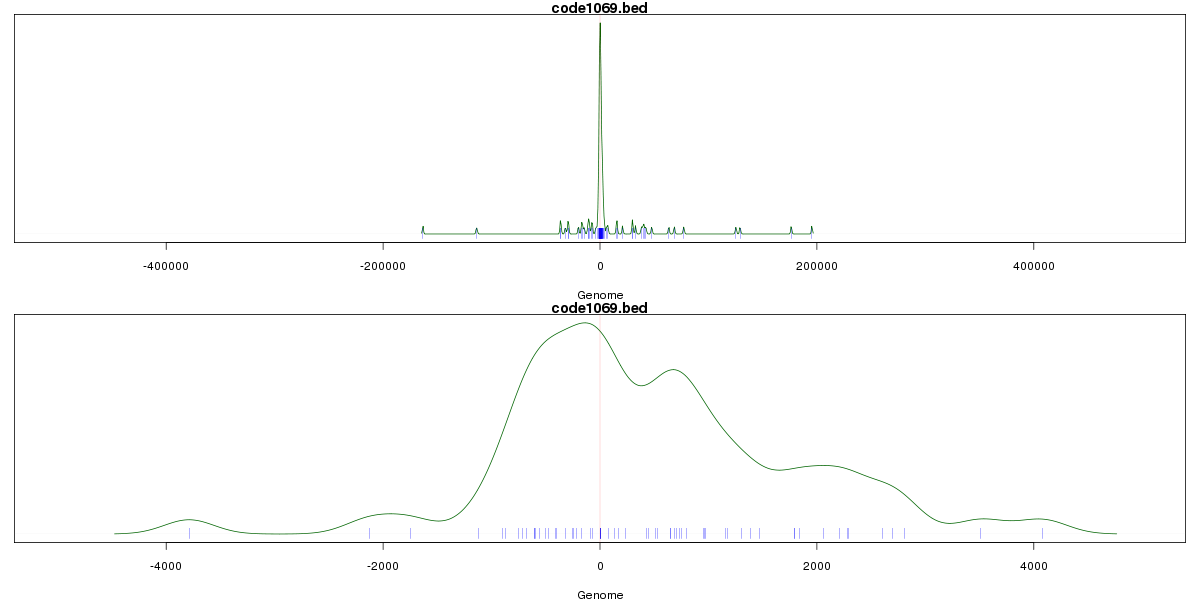
Stats
Number of sites: 120Promoter: 31%
CpG-Island: 9%
Conserved: 65%
Enriched Motifs & Matches
Match Detail: [Jaspar]
|
| ||
|---|---|---|
| Sites: 33/100 | e-val: 0.000000000023 | ||
| Factor | e-val(match) | DB |
| Foxd3 | 0.000066823 | JASPAR |
| FOXA1 | 0.0020449 | JASPAR |
| Foxq1 | 0.0037448 | JASPAR |
| Foxa2 | 0.0073273 | JASPAR |
| FOXF2 | 0.0081227 | JASPAR |
BED file downloads
Top 10 Example Regions
| Location | Gene Link | Dist. |
|---|---|---|
| chr9: 130856420-130856570 | RP11-379C10.4 | 36.9 |
| chr9: 133709920-133710070 | QRFP | 49.2 |
| chr7: 134832740-134832890 | TMEM140 | 51.96 |
| chr16: 4898440-4898590 | AC020663.1 | 52.43 |
| chr16: 56390760-56390910 | AMFR | 63.59 |
| chr16: 56390760-56390910 | GNAO1 | 63.59 |
| chr22: 24372380-24372530 | GSTT1 | 65.13 |
| chr4: 77119880-77120030 | NUP54 | 65.93 |
| chr4: 77119880-77120030 | SCARB2 | 65.93 |
| chr21: 34697660-34697810 | AP000295.9 | 67.54 |