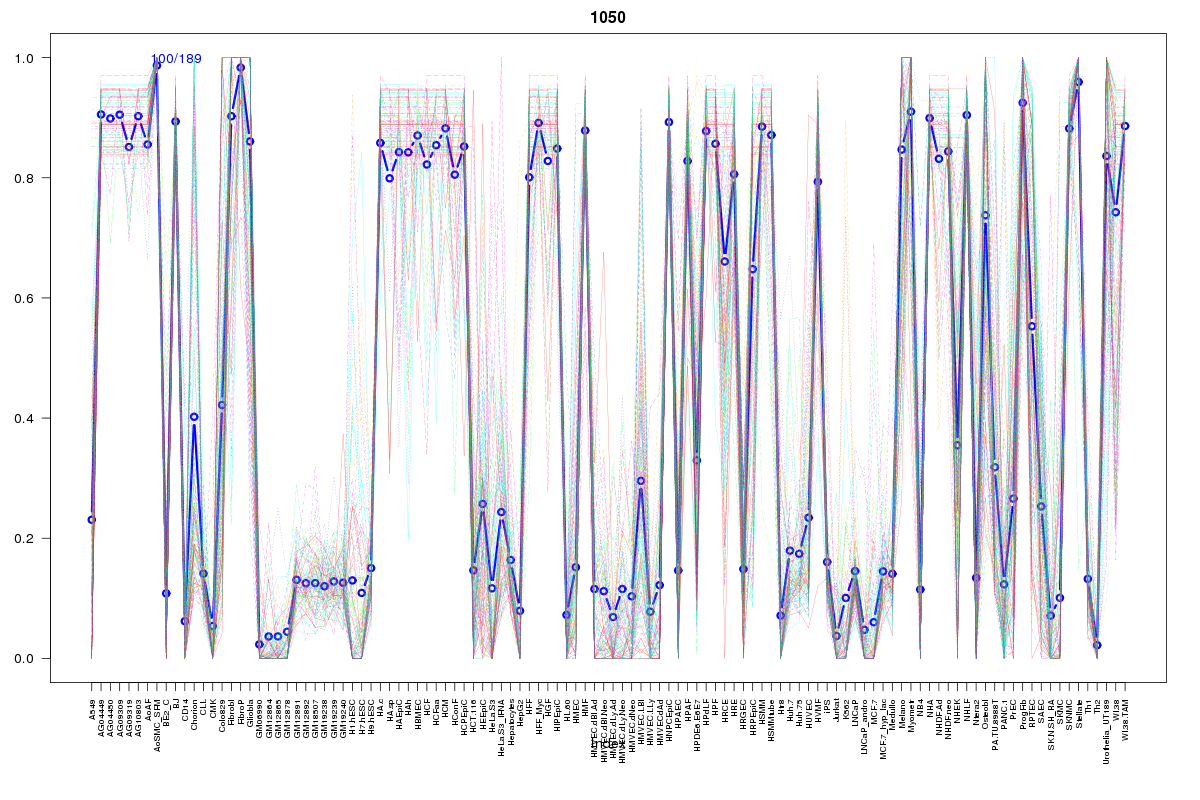
SOM cluster: 1050
Cluster Hypersensitivity Profile

Genomic Location Trend
These plots show the distribution of the DHS sites surrounding the Transcript Start Site of the nearest gene.
Stats
Number of sites: 189Promoter: 2%
CpG-Island: 1%
Conserved: 58%
Enriched Motifs & Matches
Match Detail: [Jaspar]
|
| ||
|---|---|---|
| Sites: 43/100 | e-val: 4.9e-16 | ||
| Factor | e-val(match) | DB |
| RUNX1 | 0.000000031835 | JASPAR |
| RREB1 | 0.000041208 | JASPAR |
| ZNF354C | 0.00085089 | JASPAR |
| Tcfcp2l1 | 0.0015637 | JASPAR |
| IRF2 | 0.0044235 | JASPAR |
|
| ||
| Sites: 29/100 | e-val: 0.00094 | ||
| Factor | e-val(match) | DB |
| Tal1::Gata1 | 0.0024091 | JASPAR |
| Myf | 0.0025683 | JASPAR |
| ZNF354C | 0.0044614 | JASPAR |
| SP1 | 0.0083487 | JASPAR |
| NFATC2 | 0.010986 | JASPAR |
|
| ||
| Sites: 27/100 | e-val: 0.0023 | ||
| Factor | e-val(match) | DB |
| AP1 | 0.00000000011296 | JASPAR |
| NFE2L2 | 0.0000000090165 | JASPAR |
| PPARG | 0.0035063 | JASPAR |
| NFE2L1::MafG | 0.0045934 | JASPAR |
| PBX1 | 0.0072312 | JASPAR |