SOM cluster: 105
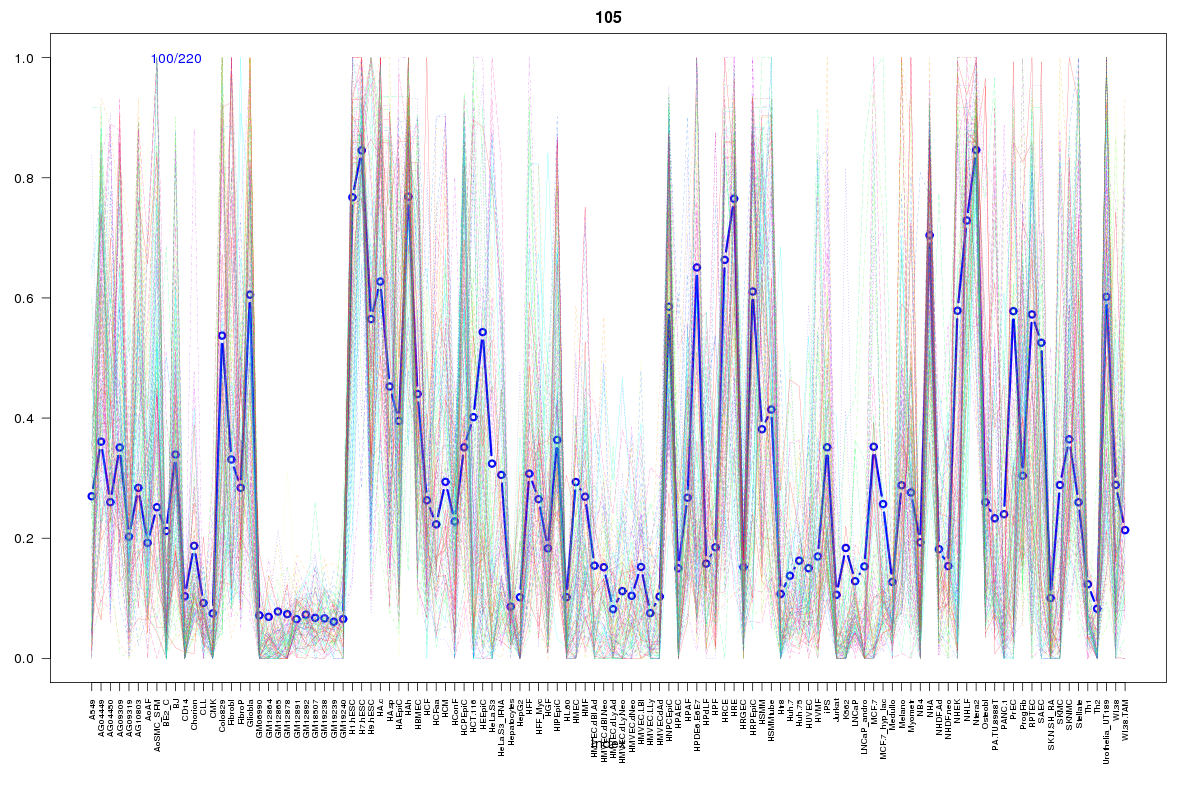
Cluster Hypersensitivity Profile

Genomic Location Trend
These plots show the distribution of the DHS sites surrounding the Transcript Start Site of the nearest gene.
Stats
Number of sites: 220Promoter: 1%
CpG-Island: 0%
Conserved: 49%
Enriched Motifs & Matches
Match Detail: [Jaspar]
|
| ||
|---|---|---|
| Sites: 47/100 | e-val: 4e-16 | ||
| Factor | e-val(match) | DB |
| TEAD1 | 0.00000000052545 | JASPAR |
| SPI1 | 0.00087486 | JASPAR |
| RELA | 0.0015446 | JASPAR |
| NF-kappaB | 0.0024498 | JASPAR |
| SPIB | 0.0040033 | JASPAR |
BED file downloads
Top 10 Example Regions
| Location | Gene Link | Dist. |
|---|---|---|
| chr17: 70599160-70599310 | LINC00511 | 35.2 |
| chr17: 60902020-60902170 | MARCH10 | 50.99 |
| chr21: 41160300-41160450 | PCP4 | 52.84 |
| chr21: 41160300-41160450 | AF064860.7 | 52.84 |
| chr3: 14371060-14371210 | RP11-536I6.2 | 55.46 |
| chr3: 14371060-14371210 | SLC6A6 | 55.46 |
| chr6: 17876360-17876510 | KIF13A | 59.75 |
| chr12: 106477765-106477915 | NUAK1 | 61.13 |
| chr1: 197744940-197745090 | Y_RNA | 61.42 |
| chr19: 44191320-44191470 | RN7SL368P | 61.61 |