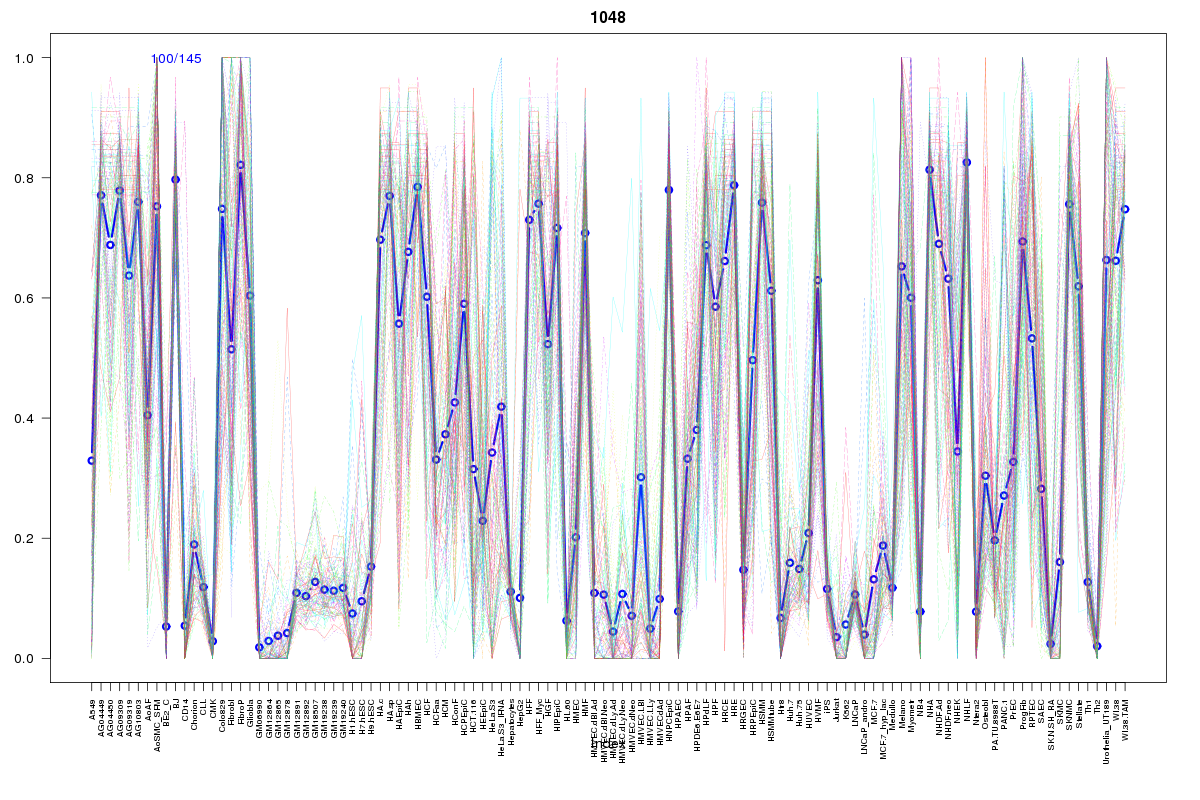
SOM cluster: 1048
Cluster Hypersensitivity Profile

Genomic Location Trend
These plots show the distribution of the DHS sites surrounding the Transcript Start Site of the nearest gene.
Stats
Number of sites: 145Promoter: 3%
CpG-Island: 0%
Conserved: 46%
Enriched Motifs & Matches
Match Detail: [Jaspar]
|
| ||
|---|---|---|
| Sites: 43/100 | e-val: 0.00000000000002 | ||
| Factor | e-val(match) | DB |
| AP1 | 0.000000000014936 | JASPAR |
| NFE2L2 | 0.0000000084457 | JASPAR |
| PPARG | 0.0034593 | JASPAR |
| NFE2L1::MafG | 0.0067234 | JASPAR |
| PBX1 | 0.011159 | JASPAR |
|
| ||
| Sites: 25/100 | e-val: 0.025 | ||
| Factor | e-val(match) | DB |
| Pax4 | 0.000057937 | JASPAR |
| Foxd3 | 0.0014667 | JASPAR |
| NR4A2 | 0.01117 | JASPAR |
| FOXI1 | 0.01408 | JASPAR |
| SRY | 0.014173 | JASPAR |
BED file downloads
Top 10 Example Regions
| Location | Gene Link | Dist. |
|---|---|---|
| chr1: 172312660-172312810 | C1orf105 | 30.78 |
| chr3: 32010705-32010855 | OSBPL10 | 35.99 |
| chr1: 78005640-78005790 | ZZZ3 | 45.38 |
| chr1: 78005640-78005790 | AK5 | 45.38 |
| chr1: 210567140-210567290 | HHAT | 46.49 |
| chr4: 77645200-77645350 | SHROOM3 | 59.55 |
| chr11: 85471020-85471170 | SYTL2 | 62.78 |
| chr3: 145849960-145850110 | PLOD2 | 66.42 |
| chr17: 48296125-48296275 | RP11-893F2.9 | 67.35 |
| chr17: 48296125-48296275 | COL1A1 | 67.35 |