SOM cluster: 1044
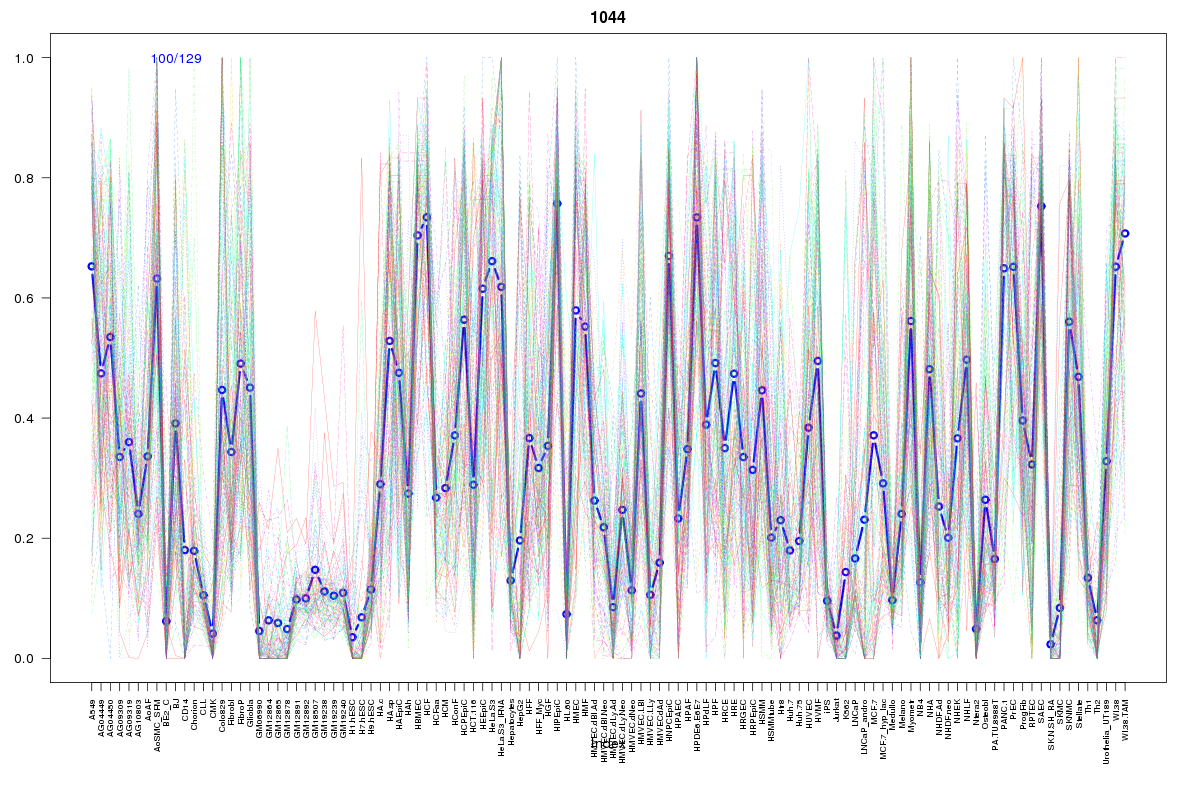
Cluster Hypersensitivity Profile

Genomic Location Trend
These plots show the distribution of the DHS sites surrounding the Transcript Start Site of the nearest gene.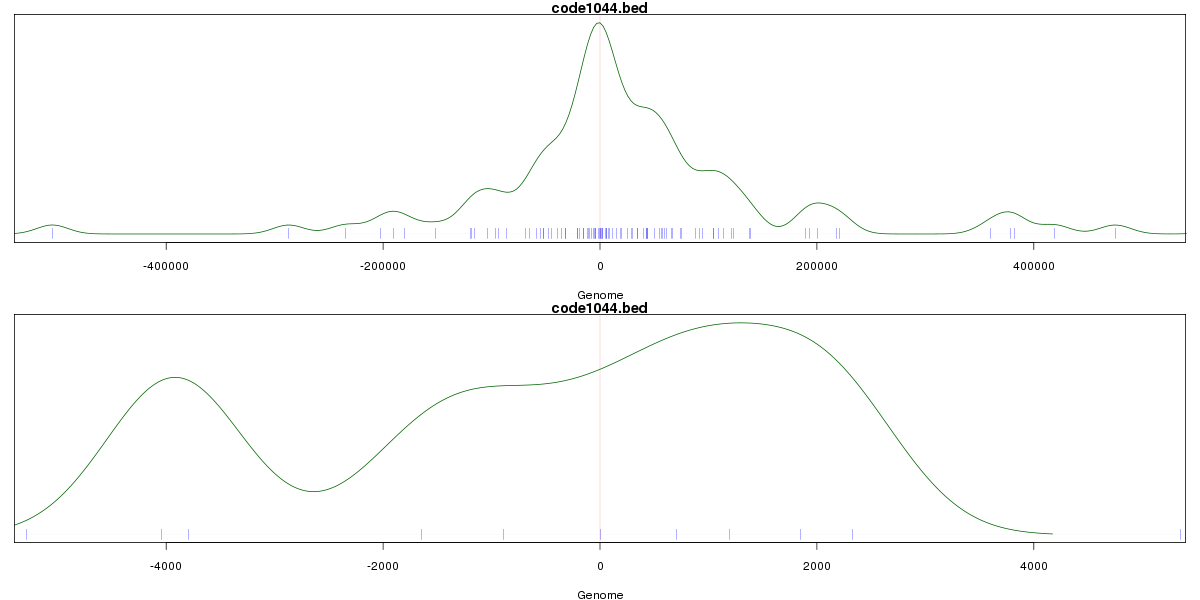
Stats
Number of sites: 129Promoter: 3%
CpG-Island: 0%
Conserved: 38%
Enriched Motifs & Matches
Match Detail: [Jaspar]
|
| ||
|---|---|---|
| Sites: 58/100 | e-val: 1.5e-28 | ||
| Factor | e-val(match) | DB |
| AP1 | 0.0000000021151 | JASPAR |
| NFE2L2 | 0.0000000041053 | JASPAR |
| NFE2L1::MafG | 0.000085929 | JASPAR |
| PBX1 | 0.015096 | JASPAR |
| Pax2 | 0.016074 | JASPAR |
|
| ||
| Sites: 33/100 | e-val: 0.37 | ||
| Factor | e-val(match) | DB |
| FOXO3 | 0.00000028373 | JASPAR |
| FOXD1 | 0.0000046486 | JASPAR |
| Foxd3 | 0.000046076 | JASPAR |
| Foxa2 | 0.00023463 | JASPAR |
| FOXA1 | 0.00024099 | JASPAR |
BED file downloads
Top 10 Example Regions
| Location | Gene Link | Dist. |
|---|---|---|
| chr8: 101960320-101960470 | RN7SL685P | 34.16 |
| chr11: 20000380-20000530 | NAV2 | 53.5 |
| chr3: 152858640-152858790 | RAP2B | 61.65 |
| chr5: 68798680-68798830 | GTF2H2C | 66.32 |
| chr12: 597100-597250 | RP5-1154L15.2 | 67.06 |
| chr12: 597100-597250 | NINJ2 | 67.06 |
| chr2: 167230580-167230730 | SCN9A | 70.08 |
| chr2: 167230580-167230730 | AC010127.3 | 70.08 |
| chr17: 20110020-20110170 | SPECC1 | 74.88 |
| chr5: 73060560-73060710 | ARHGEF28 | 75.76 |