SOM cluster: 1043
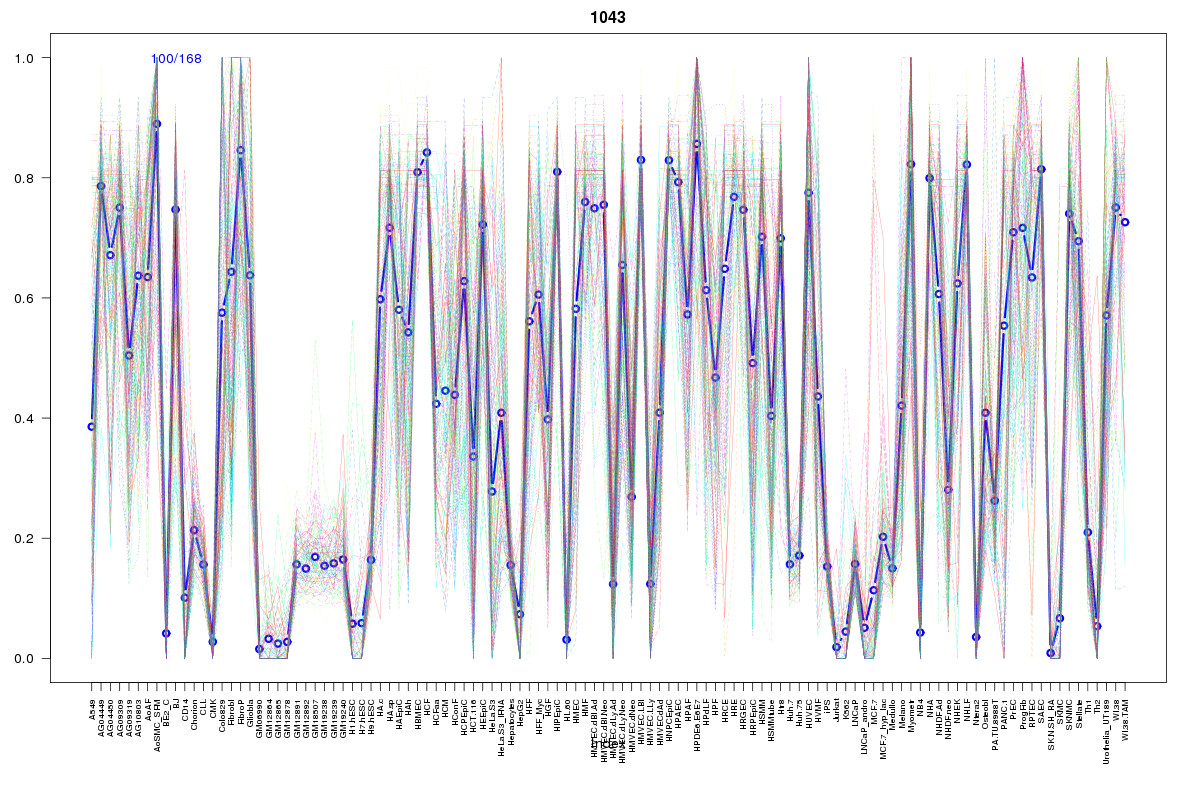
Cluster Hypersensitivity Profile

Genomic Location Trend
These plots show the distribution of the DHS sites surrounding the Transcript Start Site of the nearest gene.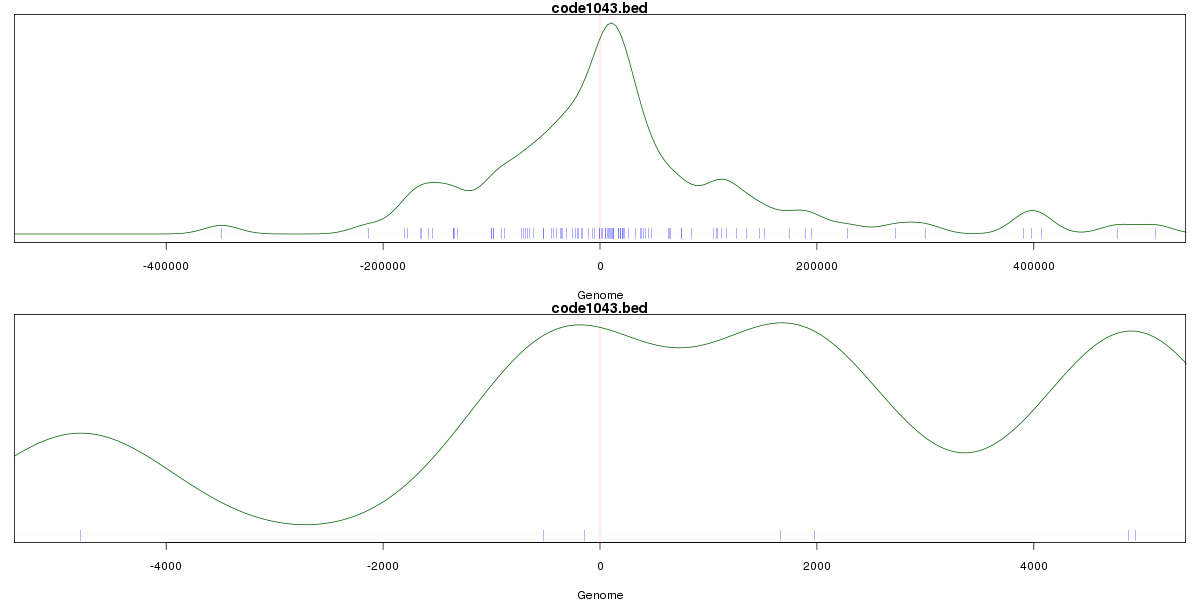
Stats
Number of sites: 168Promoter: 2%
CpG-Island: 0%
Conserved: 54%
Enriched Motifs & Matches
Match Detail: [Jaspar]
|
| ||
|---|---|---|
| Sites: 70/100 | e-val: 0 | ||
| Factor | e-val(match) | DB |
| AP1 | 0.00000010599 | JASPAR |
| NFE2L2 | 0.0000005353 | JASPAR |
| PBX1 | 0.0053083 | JASPAR |
| Pax6 | 0.017415 | JASPAR |
| NFE2L1::MafG | 0.018791 | JASPAR |
|
| ||
| Sites: 37/100 | e-val: 0.025 | ||
| Factor | e-val(match) | DB |
| Foxd3 | 0.00012312 | JASPAR |
| FEV | 0.00012898 | JASPAR |
| HNF1A | 0.00040191 | JASPAR |
| NFATC2 | 0.00059101 | JASPAR |
| SPI1 | 0.0011837 | JASPAR |
BED file downloads
Top 10 Example Regions
| Location | Gene Link | Dist. |
|---|---|---|
| chr9: 72591220-72591370 | MAMDC2 | 52.29 |
| chr9: 72591220-72591370 | C9orf135 | 52.29 |
| chr11: 111815560-111815710 | CRYAB | 56.87 |
| chr11: 111815560-111815710 | RP11-708L7.6 | 56.87 |
| chr11: 111815560-111815710 | C11orf1 | 56.87 |
| chr11: 111815560-111815710 | FDXACB1 | 56.87 |
| chr11: 111815560-111815710 | DIXDC1 | 56.87 |
| chr11: 111815560-111815710 | DLAT | 56.87 |
| chr2: 167096180-167096330 | SCN9A | 57.75 |
| chr7: 90224400-90224550 | CDK14 | 62.13 |