SOM cluster: 1036
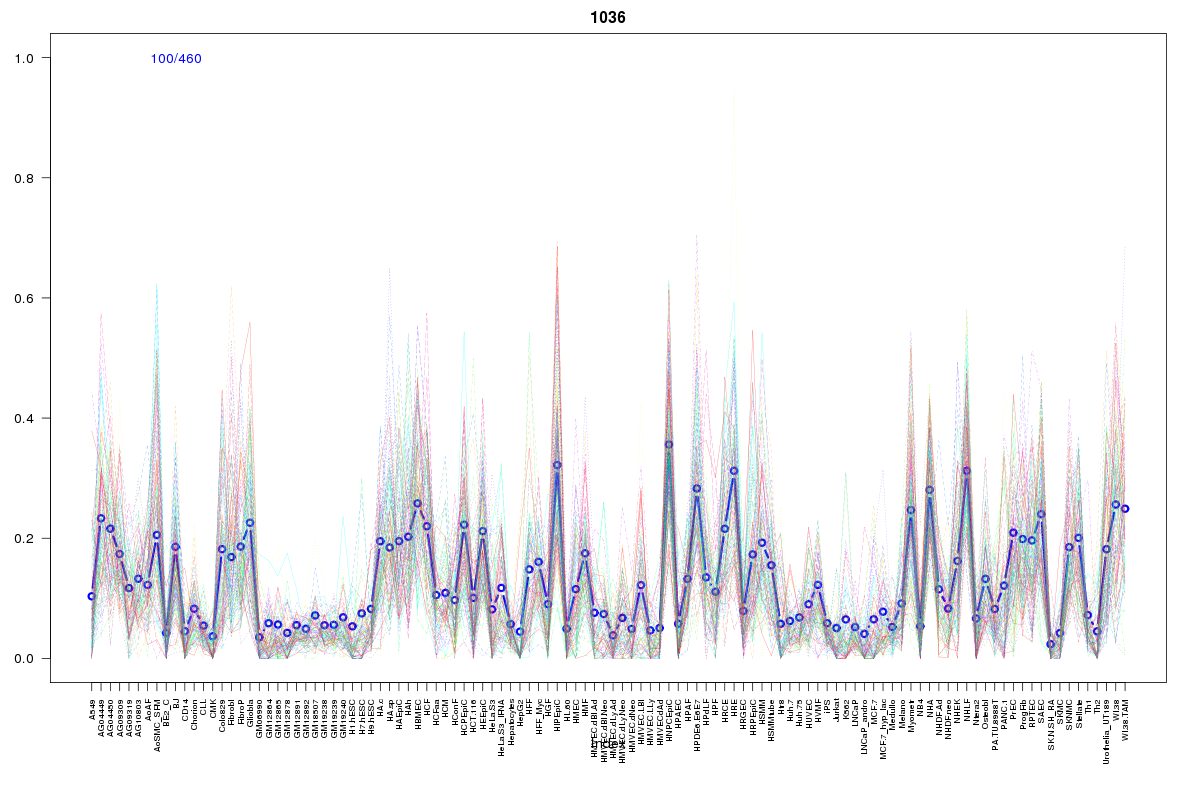
Cluster Hypersensitivity Profile

Genomic Location Trend
These plots show the distribution of the DHS sites surrounding the Transcript Start Site of the nearest gene.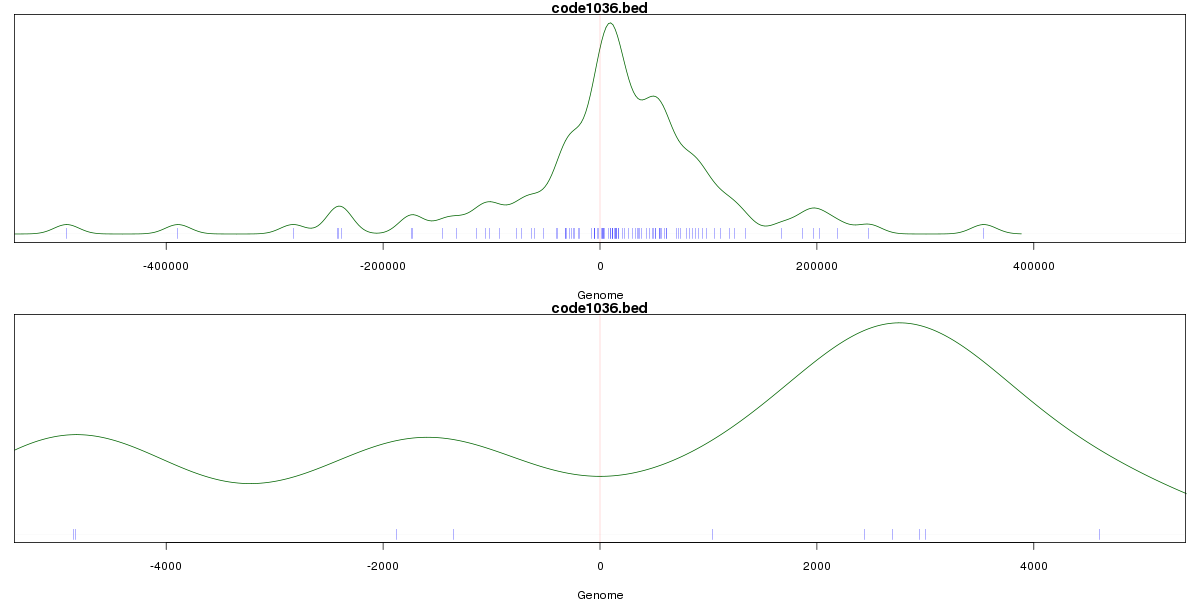
Stats
Number of sites: 460Promoter: 2%
CpG-Island: 0%
Conserved: 21%
Enriched Motifs & Matches
Match Detail: [Jaspar]
|
| ||
|---|---|---|
| Sites: 40/100 | e-val: 7.5e-18 | ||
| Factor | e-val(match) | DB |
| AP1 | 0.0000000027022 | JASPAR |
| NFE2L2 | 0.000000030855 | JASPAR |
| NFE2L1::MafG | 0.00014162 | JASPAR |
| PPARG | 0.0018041 | JASPAR |
| PBX1 | 0.01799 | JASPAR |
BED file downloads
Top 10 Example Regions
| Location | Gene Link | Dist. |
|---|---|---|
| chr3: 128218825-128218975 | EEFSEC | 37.48 |
| chr8: 38770105-38770255 | ADAM9 | 38.43 |
| chr9: 79048860-79049010 | GCNT1 | 39.51 |
| chr1: 207961200-207961350 | RP11-454L1.2 | 40.65 |
| chr1: 207961200-207961350 | CD34 | 40.65 |
| chr6: 32874460-32874610 | HLA-DMA | 44.26 |
| chr6: 32874460-32874610 | HLA-DOA | 44.26 |
| chr10: 91503900-91504050 | RP11-80H5.2 | 45.78 |
| chr8: 38862565-38862715 | TM2D2 | 51.84 |
| chr4: 40582285-40582435 | RP11-588L15.1 | 54.21 |