SOM cluster: 1029
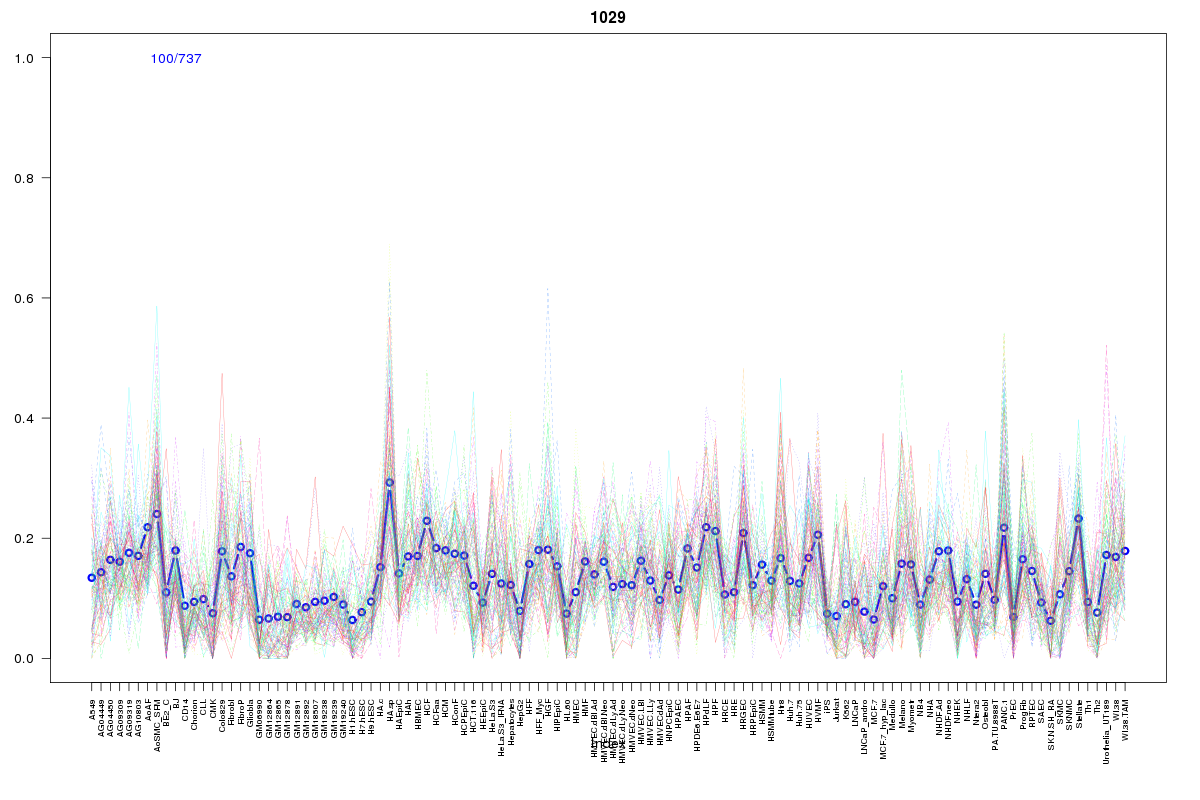
Cluster Hypersensitivity Profile

Genomic Location Trend
These plots show the distribution of the DHS sites surrounding the Transcript Start Site of the nearest gene.
Stats
Number of sites: 737Promoter: 19%
CpG-Island: 2%
Conserved: 50%
Enriched Motifs & Matches
Match Detail: [Jaspar]
|
| ||
|---|---|---|
| Sites: 35/100 | e-val: 0.00000000011 | ||
| Factor | e-val(match) | DB |
| EWSR1-FLI1 | 0.000072587 | JASPAR |
| IRF1 | 0.0023255 | JASPAR |
| Pax4 | 0.0025544 | JASPAR |
| Foxd3 | 0.0040175 | JASPAR |
| MEF2A | 0.0082356 | JASPAR |
BED file downloads
Top 10 Example Regions
| Location | Gene Link | Dist. |
|---|---|---|
| chr1: 91978840-91978990 | CDC7 | 24.36 |
| chr3: 194295500-194295650 | ATP13A3 | 33.53 |
| chr3: 194295500-194295650 | AC046143.3 | 33.53 |
| chr9: 109626800-109626950 | RP11-508N12.4 | 41.53 |
| chr9: 109626800-109626950 | ZNF462 | 41.53 |
| chr5: 73938880-73939030 | HEXB | 42.05 |
| chr1: 151298660-151298810 | POGZ | 43.16 |
| chr1: 151298660-151298810 | RFX5 | 43.16 |
| chr1: 151298660-151298810 | PI4KB | 43.16 |
| chr1: 151298660-151298810 | SELENBP1 | 43.16 |