SOM cluster: 1025
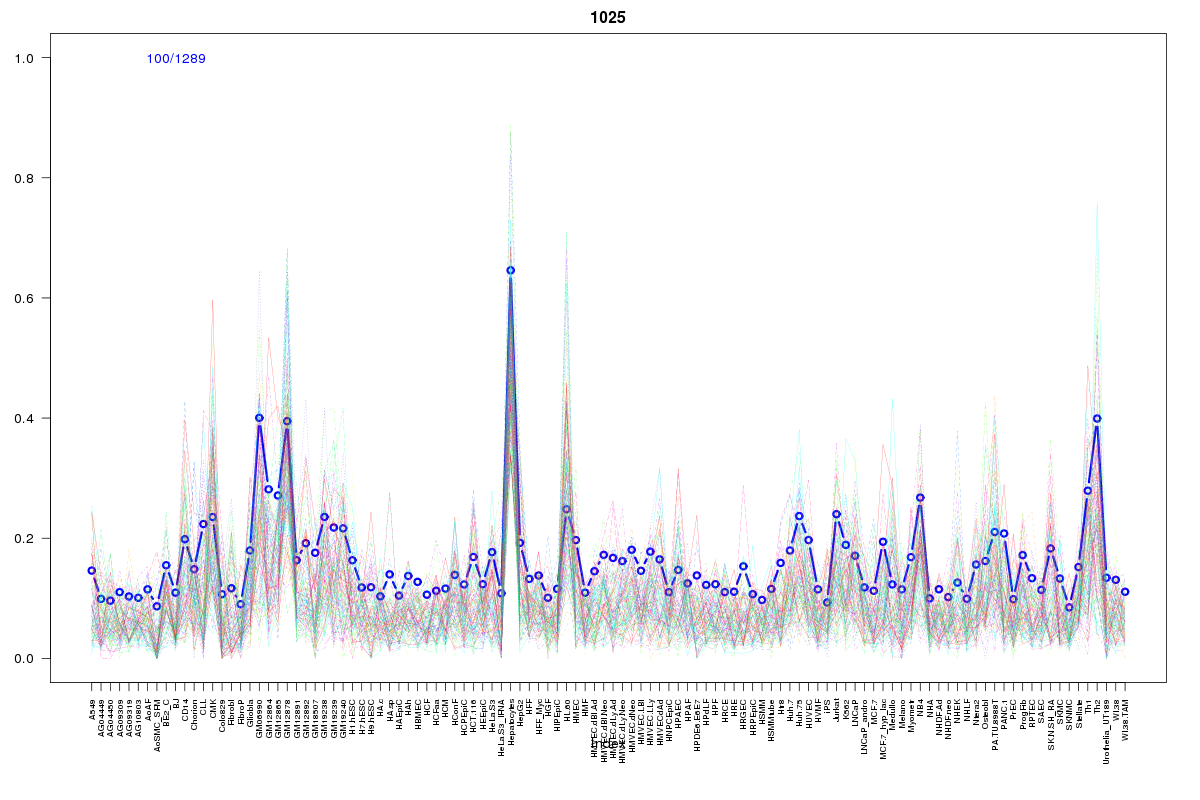
Cluster Hypersensitivity Profile

Genomic Location Trend
These plots show the distribution of the DHS sites surrounding the Transcript Start Site of the nearest gene.
Stats
Number of sites: 1289Promoter: 28%
CpG-Island: 6%
Conserved: 30%
Enriched Motifs & Matches
Match Detail: [Jaspar]
|
| ||
|---|---|---|
| Sites: 41/100 | e-val: 1e-16 | ||
| Factor | e-val(match) | DB |
| EWSR1-FLI1 | 0.000000044184 | JASPAR |
| SP1 | 0.00000039303 | JASPAR |
| SPI1 | 0.000070774 | JASPAR |
| Pax4 | 0.00035031 | JASPAR |
| SPIB | 0.0011631 | JASPAR |
|
| ||
| Sites: 58/100 | e-val: 0.000018 | ||
| Factor | e-val(match) | DB |
| SP1 | 0.00010794 | JASPAR |
| INSM1 | 0.0019183 | JASPAR |
| znf143 | 0.0029203 | JASPAR |
| Zfx | 0.0035697 | JASPAR |
| ESR1 | 0.0057974 | JASPAR |
|
| ||
| Sites: 24/100 | e-val: 2.5 | ||
| Factor | e-val(match) | DB |
| RREB1 | 0.00000052097 | JASPAR |
| Myf | 0.000034059 | JASPAR |
| Klf4 | 0.0033561 | JASPAR |
| SP1 | 0.0095697 | JASPAR |
| Egr1 | 0.0098932 | JASPAR |
BED file downloads
Top 10 Example Regions
| Location | Gene Link | Dist. |
|---|---|---|
| chr12: 6981340-6981490 | CDCA3 | 44.23 |
| chr12: 6981340-6981490 | EMG1 | 44.23 |
| chr12: 6981340-6981490 | TPI1 | 44.23 |
| chr12: 6981340-6981490 | PHB2 | 44.23 |
| chr12: 6981340-6981490 | C12orf57 | 44.23 |
| chr12: 6981340-6981490 | SCARNA12 | 44.23 |
| chr12: 6981340-6981490 | LEPREL2 | 44.23 |
| chr12: 6981340-6981490 | PTPN6 | 44.23 |
| chr10: 98479400-98479550 | PIK3AP1 | 44.74 |
| chr10: 98479400-98479550 | RP11-34E5.4 | 44.74 |