SOM cluster: 1017
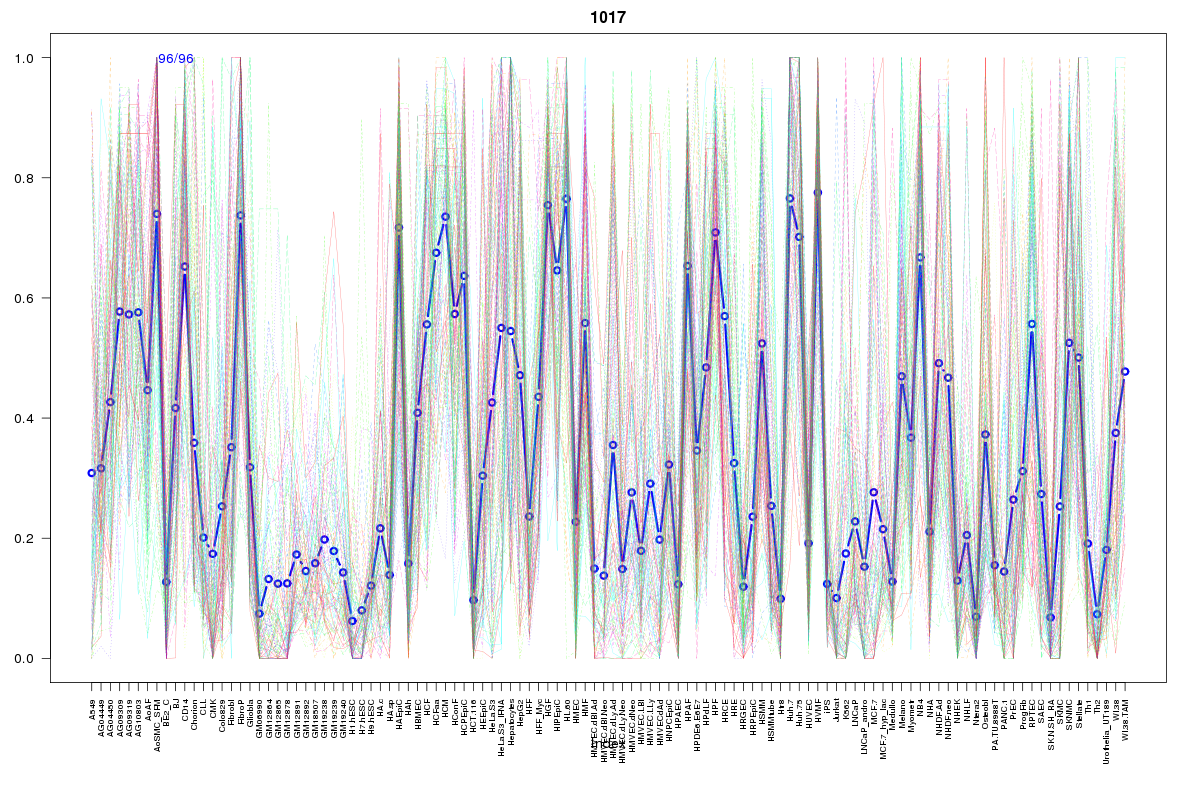
Cluster Hypersensitivity Profile

Genomic Location Trend
These plots show the distribution of the DHS sites surrounding the Transcript Start Site of the nearest gene.
Stats
Number of sites: 96Promoter: 12%
CpG-Island: 1%
Conserved: 47%
Enriched Motifs & Matches
Match Detail: [Jaspar]
|
| ||
|---|---|---|
| Sites: 69/96 | e-val: 3.9e-36 | ||
| Factor | e-val(match) | DB |
| CEBPA | 0.000000022151 | JASPAR |
| HLF | 0.001025 | JASPAR |
| Pou5f1 | 0.0017301 | JASPAR |
| Sox2 | 0.0023417 | JASPAR |
| NFATC2 | 0.0078317 | JASPAR |
BED file downloads
Top 10 Example Regions
| Location | Gene Link | Dist. |
|---|---|---|
| chr8: 124179880-124180030 | HMGB1P19 | 43.26 |
| chr9: 133321060-133321210 | snoU13 | 49.92 |
| chr20: 36796780-36796930 | TGM2 | 55.23 |
| chr19: 21752060-21752210 | ZNF429 | 57.2 |
| chr1: 145144500-145144650 | PDE4DIP | 60.77 |
| chr1: 145144500-145144650 | SEC22B | 60.77 |
| chr17: 79301060-79301210 | SLC38A10 | 66.29 |
| chr17: 79301060-79301210 | ENTHD2 | 66.29 |
| chr6: 139691280-139691430 | RP11-12A2.1 | 67.94 |
| chr6: 139691280-139691430 | RP11-445F6.2 | 67.94 |