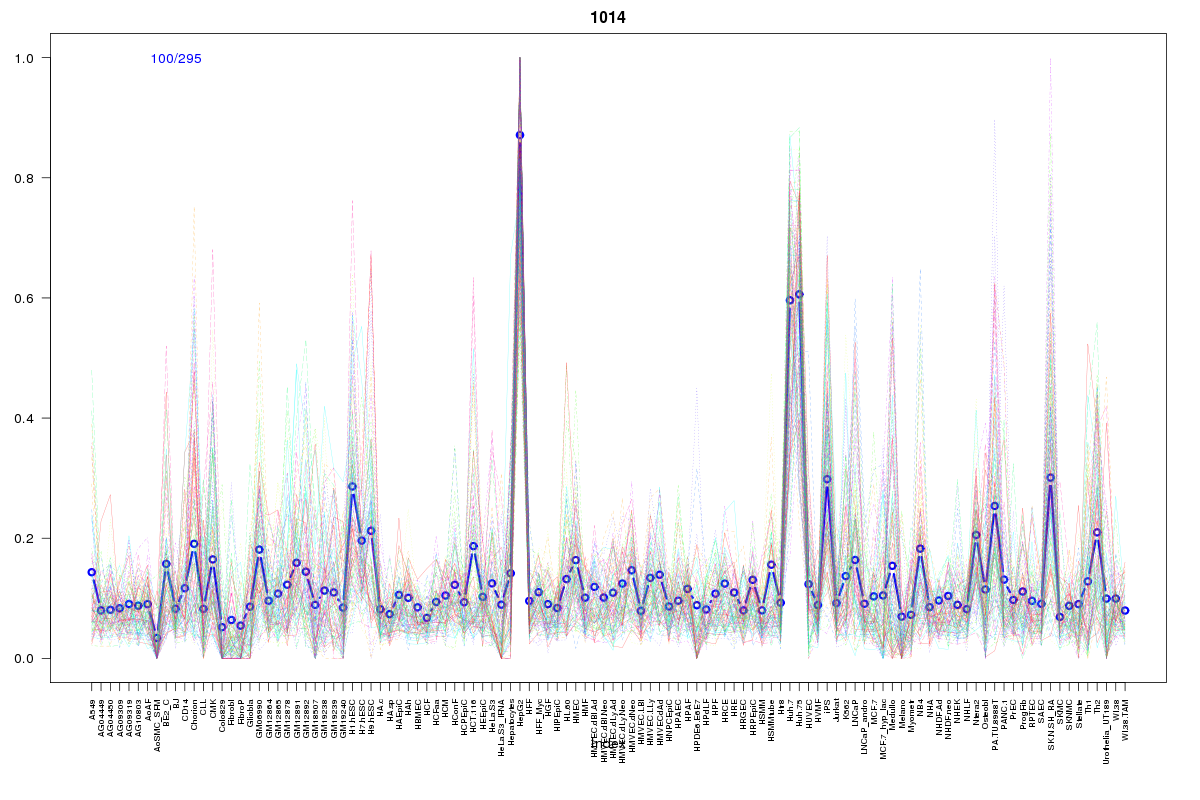
SOM cluster: 1014
Cluster Hypersensitivity Profile

Genomic Location Trend
These plots show the distribution of the DHS sites surrounding the Transcript Start Site of the nearest gene.
Stats
Number of sites: 295Promoter: 24%
CpG-Island: 45%
Conserved: 55%
Enriched Motifs & Matches
Match Detail: [Jaspar]
|
| ||
|---|---|---|
| Sites: 95/100 | e-val: 0 | ||
| Factor | e-val(match) | DB |
| SP1 | 0.00000000089923 | JASPAR |
| TFAP2A | 0.000023448 | JASPAR |
| Egr1 | 0.001187 | JASPAR |
| INSM1 | 0.0017542 | JASPAR |
| Klf4 | 0.0050463 | JASPAR |
|
| ||
| Sites: 56/100 | e-val: 4.4e-20 | ||
| Factor | e-val(match) | DB |
| SP1 | 0.00000016674 | JASPAR |
| TFAP2A | 0.000071001 | JASPAR |
| RREB1 | 0.0024859 | JASPAR |
| Klf4 | 0.0037821 | JASPAR |
| Egr1 | 0.024124 | JASPAR |
|
| ||
| Sites: 45/100 | e-val: 0.31 | ||
| Factor | e-val(match) | DB |
| SP1 | 0.000001482 | JASPAR |
| PLAG1 | 0.00157 | JASPAR |
| Klf4 | 0.0034624 | JASPAR |
| NHLH1 | 0.0066381 | JASPAR |
| TFAP2A | 0.011419 | JASPAR |
BED file downloads
Top 10 Example Regions
| Location | Gene Link | Dist. |
|---|---|---|
| chr16: 89985280-89985430 | AFG3L1P | 47.18 |
| chr16: 89985280-89985430 | DEF8 | 47.18 |
| chr16: 89985280-89985430 | CENPBD1 | 47.18 |
| chr16: 89985280-89985430 | SPIRE2 | 47.18 |
| chr11: 2031920-2032070 | MRPL23-AS1 | 48.67 |
| chr13: 28534685-28534835 | CDX2 | 50.66 |
| chrX: 152907665-152907815 | PNCK | 51.89 |
| chrX: 152907665-152907815 | DUSP9 | 51.89 |
| chrX: 152907665-152907815 | KRT18P48 | 51.89 |
| chr20: 30157040-30157190 | RP3-324O17.4 | 54.12 |