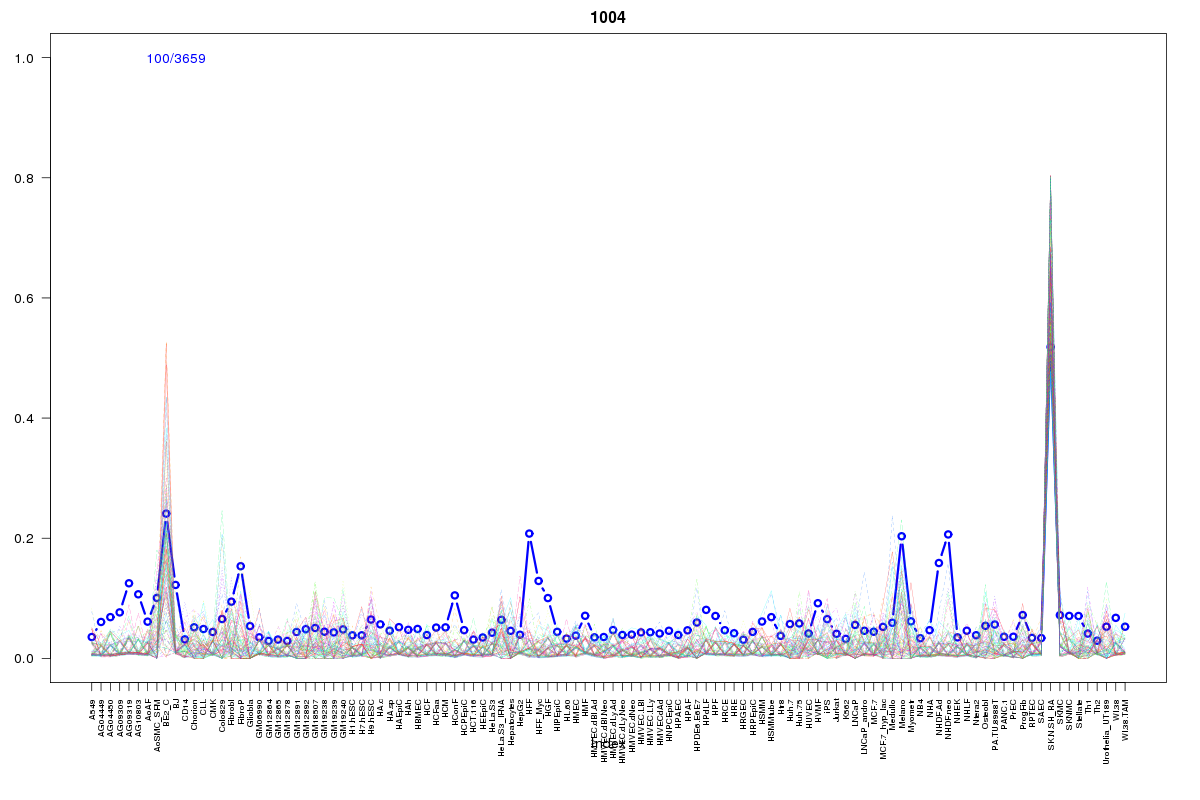
SOM cluster: 1004
Cluster Hypersensitivity Profile

Genomic Location Trend
These plots show the distribution of the DHS sites surrounding the Transcript Start Site of the nearest gene.
Stats
Number of sites: 3659Promoter: 0%
CpG-Island: 0%
Conserved: 59%
Enriched Motifs & Matches
Match Detail: [Jaspar]
|
| ||
|---|---|---|
| Sites: 71/100 | e-val: 2.8e-40 | ||
| Factor | e-val(match) | DB |
| Foxd3 | 0.00066048 | JASPAR |
| Lhx3 | 0.00084333 | JASPAR |
| MEF2A | 0.00088763 | JASPAR |
| Foxq1 | 0.0011823 | JASPAR |
| Sox2 | 0.0049152 | JASPAR |
|
| ||
| Sites: 37/100 | e-val: 0.00000000000032 | ||
| Factor | e-val(match) | DB |
| Lhx3 | 0.00000062839 | JASPAR |
| Prrx2 | 0.00096383 | JASPAR |
| ARID3A | 0.0029364 | JASPAR |
| Pdx1 | 0.006444 | JASPAR |
| HNF1A | 0.012162 | JASPAR |
|
| ||
| Sites: 26/100 | e-val: 0.000000000024 | ||
| Factor | e-val(match) | DB |
| NFATC2 | 0.000044518 | JASPAR |
| IRF1 | 0.00014015 | JASPAR |
| FOXA1 | 0.0097699 | JASPAR |
| IRF2 | 0.012125 | JASPAR |
| Foxq1 | 0.018493 | JASPAR |
BED file downloads
Top 10 Example Regions
| Location | Gene Link | Dist. |
|---|---|---|
| chr13: 102897180-102897330 | FGF14-IT1 | 29.64 |
| chr8: 9035760-9035910 | RP11-115J16.1 | 35.05 |
| chr11: 125923720-125923870 | CDON | 36.02 |
| chr9: 134195500-134195650 | PPAPDC3 | 41.03 |
| chr3: 37962640-37962790 | ITGA9 | 45.24 |
| chr12: 109000360-109000510 | TMEM119 | 48.16 |
| chr6: 40374040-40374190 | LRFN2 | 49.28 |
| chr6: 40374040-40374190 | LINC00951 | 49.28 |
| chr1: 49354860-49355010 | AGBL4 | 49.55 |
| chr8: 9625920-9626070 | TNKS | 50.02 |