SOM cluster: 1001
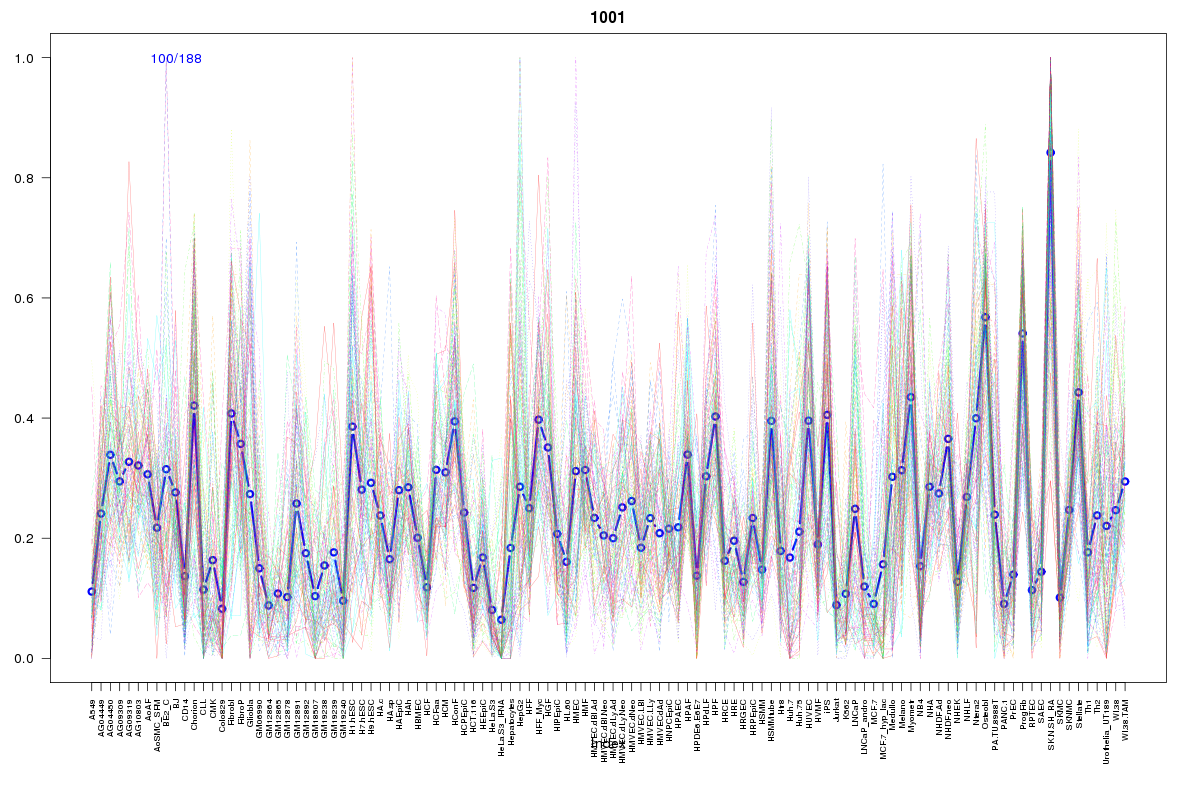
Cluster Hypersensitivity Profile

Genomic Location Trend
These plots show the distribution of the DHS sites surrounding the Transcript Start Site of the nearest gene.
Stats
Number of sites: 188Promoter: 37%
CpG-Island: 78%
Conserved: 79%
Enriched Motifs & Matches
Match Detail: [Jaspar]
|
| ||
|---|---|---|
| Sites: 100/100 | e-val: 0 | ||
| Factor | e-val(match) | DB |
| SP1 | 0.00002448 | JASPAR |
| PLAG1 | 0.0019671 | JASPAR |
| Egr1 | 0.0026717 | JASPAR |
| TFAP2A | 0.013998 | JASPAR |
| Klf4 | 0.037743 | JASPAR |
|
| ||
| Sites: 89/100 | e-val: 2.8e-37 | ||
| Factor | e-val(match) | DB |
| SP1 | 0.00000096246 | JASPAR |
| Pax5 | 0.00002683 | JASPAR |
| PLAG1 | 0.000077676 | JASPAR |
| TFAP2A | 0.000091189 | JASPAR |
| EWSR1-FLI1 | 0.0074327 | JASPAR |
BED file downloads
Top 10 Example Regions
| Location | Gene Link | Dist. |
|---|---|---|
| chr1: 180881505-180881655 | RP11-46A10.4 | 46.38 |
| chr4: 187645780-187645930 | FAT1 | 50.07 |
| chr3: 157260945-157261095 | PTX3 | 51.76 |
| chr3: 157260945-157261095 | C3orf55 | 51.76 |
| chrX: 73640600-73640750 | SLC16A2 | 55.81 |
| chrX: 73640600-73640750 | PRKRIRP1 | 55.81 |
| chr7: 43152985-43153135 | HECW1 | 58.53 |
| chr7: 43152985-43153135 | HECW1-IT1 | 58.53 |
| chr7: 45960785-45960935 | IGFBP3 | 58.79 |
| chr7: 45960785-45960935 | FTLP15 | 58.79 |