SOM cluster: 1000
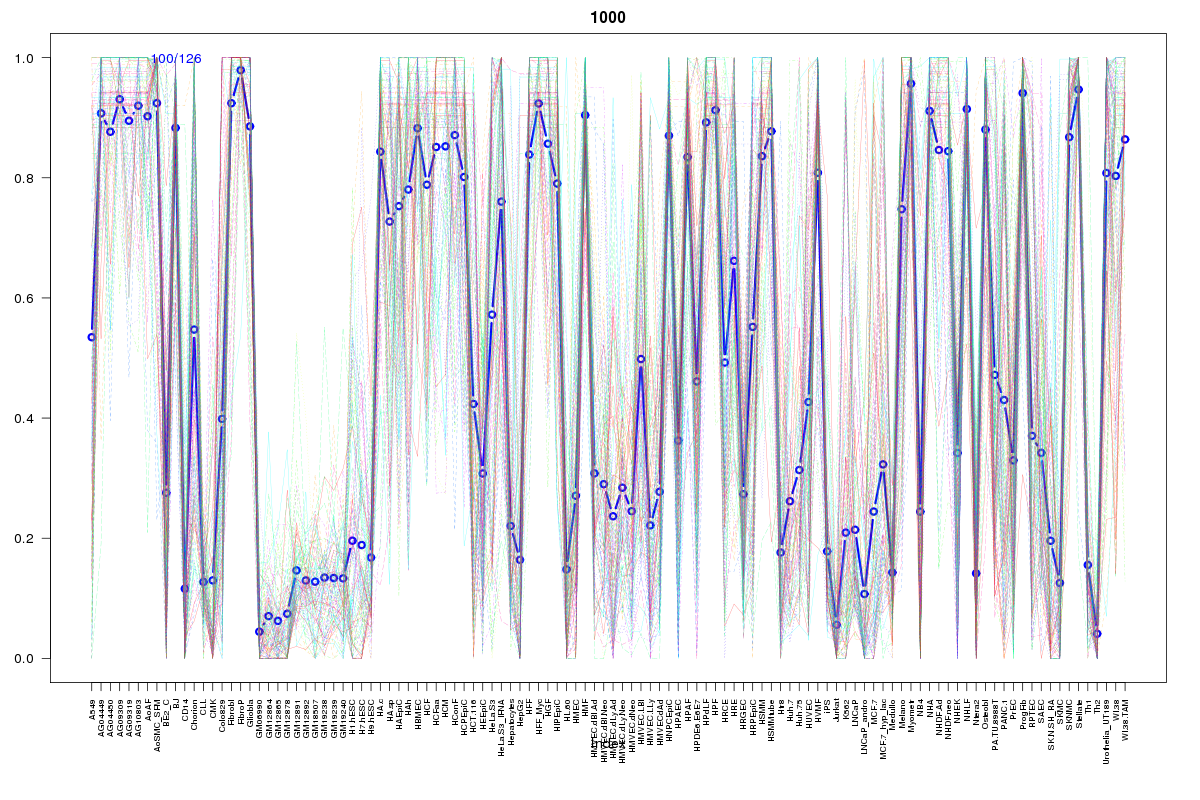
Cluster Hypersensitivity Profile

Genomic Location Trend
These plots show the distribution of the DHS sites surrounding the Transcript Start Site of the nearest gene.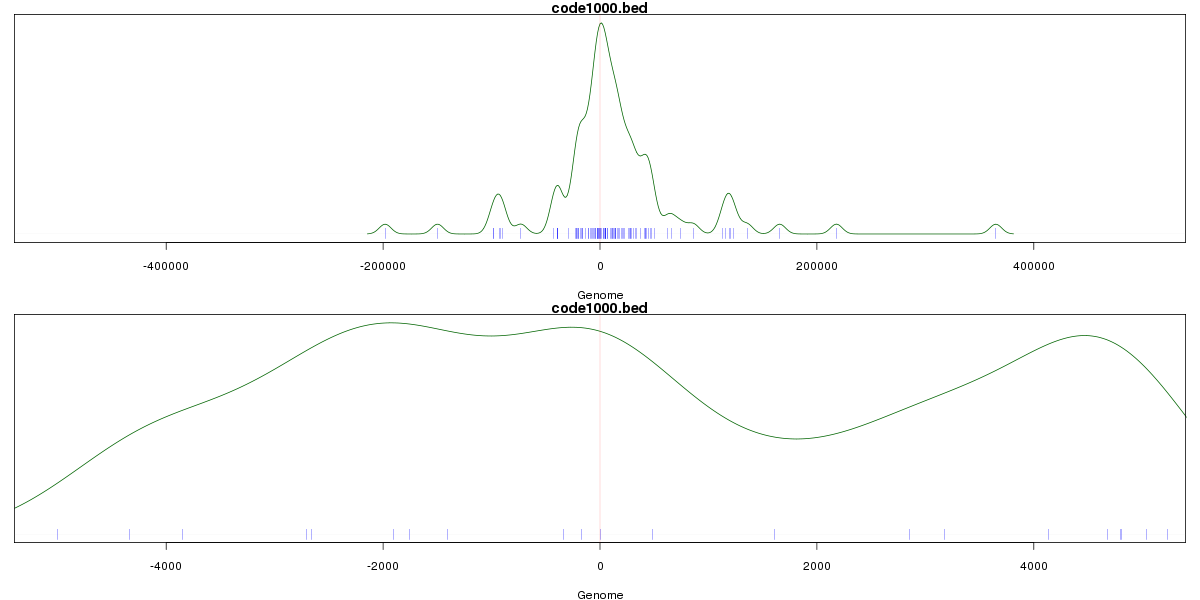
Stats
Number of sites: 126Promoter: 6%
CpG-Island: 4%
Conserved: 56%
Enriched Motifs & Matches
Match Detail: [Jaspar]
|
| ||
|---|---|---|
| Sites: 58/100 | e-val: 6.8e-36 | ||
| Factor | e-val(match) | DB |
| NFE2L2 | 0.00000000053665 | JASPAR |
| AP1 | 0.000000057317 | JASPAR |
| NFE2L1::MafG | 0.020687 | JASPAR |
| Pax2 | 0.022466 | JASPAR |
| Foxa2 | 0.034804 | JASPAR |
|
| ||
| Sites: 35/100 | e-val: 1 | ||
| Factor | e-val(match) | DB |
| SP1 | 0.0000059087 | JASPAR |
| EWSR1-FLI1 | 0.0000096415 | JASPAR |
| SPIB | 0.000039734 | JASPAR |
| TEAD1 | 0.0001949 | JASPAR |
| MZF1_1-4 | 0.00061848 | JASPAR |
|
| ||
| Sites: 21/100 | e-val: 1.3 | ||
| Factor | e-val(match) | DB |
| SP1 | 0.000055537 | JASPAR |
| Tcfcp2l1 | 0.004433 | JASPAR |
| TFAP2A | 0.020846 | JASPAR |
| ZEB1 | 0.02885 | JASPAR |
| Pax4 | 0.030961 | JASPAR |
BED file downloads
Top 10 Example Regions
| Location | Gene Link | Dist. |
|---|---|---|
| chr17: 65487300-65487450 | snoU13 | 52.68 |
| chr17: 65487300-65487450 | RN7SL756P | 52.68 |
| chr11: 130348220-130348370 | ADAMTS15 | 57.27 |
| chr11: 130348220-130348370 | RP11-121M22.1 | 57.27 |
| chr17: 74705300-74705450 | SRSF2 | 60.25 |
| chr17: 74705300-74705450 | MXRA7 | 60.25 |
| chr3: 124531700-124531850 | KALRN | 65.43 |
| chr3: 124531700-124531850 | ENO1P3 | 65.43 |
| chr3: 124531700-124531850 | ITGB5-AS1 | 65.43 |
| chr3: 124531700-124531850 | ITGB5 | 65.43 |