SOM cluster: 100
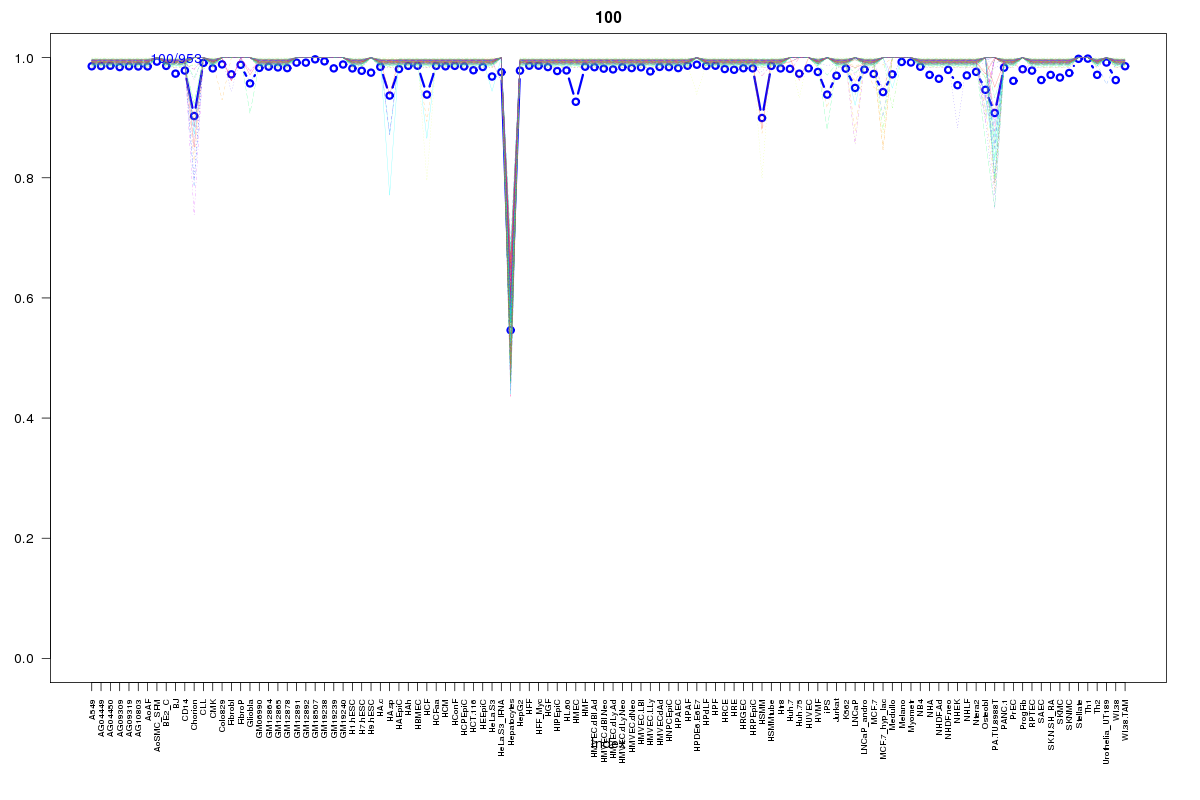
Cluster Hypersensitivity Profile

Genomic Location Trend
These plots show the distribution of the DHS sites surrounding the Transcript Start Site of the nearest gene.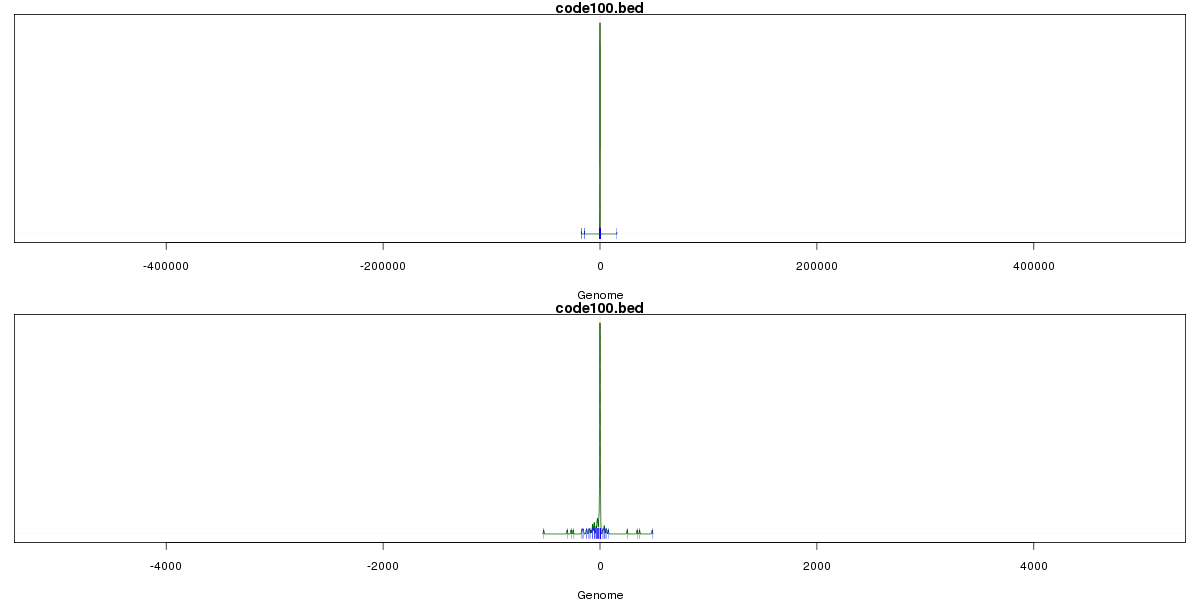
Stats
Number of sites: 953Promoter: 86%
CpG-Island: 98%
Conserved: 93%
Enriched Motifs & Matches
Match Detail: [Jaspar]
|
| ||
|---|---|---|
| Sites: 100/100 | e-val: 2.7e-30 | ||
| Factor | e-val(match) | DB |
| SP1 | 0.0000000076473 | JASPAR |
| Klf4 | 0.000035303 | JASPAR |
| TFAP2A | 0.0043984 | JASPAR |
| Egr1 | 0.016818 | JASPAR |
| PLAG1 | 0.028715 | JASPAR |
|
| ||
| Sites: 23/100 | e-val: 0.0058 | ||
| Factor | e-val(match) | DB |
| Egr1 | 0.00075722 | JASPAR |
| NHLH1 | 0.0012798 | JASPAR |
| Pax6 | 0.01649 | JASPAR |
| CEBPA | 0.02777 | JASPAR |
| TP53 | 0.06069 | JASPAR |
BED file downloads
Top 10 Example Regions
| Location | Gene Link | Dist. |
|---|---|---|
| chr1: 150849180-150849330 | CERS2 | 23.74 |
| chr1: 150849180-150849330 | CYCSP51 | 23.74 |
| chr1: 151138420-151138570 | MLLT11 | 39.77 |
| chr11: 62341265-62341415 | MTA2 | 40.43 |
| chr7: 108166560-108166710 | DNAJB9 | 46.81 |
| chr1: 150602120-150602270 | RP11-54A4.2 | 48.59 |
| chr1: 150602120-150602270 | GOLPH3L | 48.59 |
| chr2: 135676160-135676310 | ACMSD | 52.88 |
| chr15: 90931180-90931330 | AC091167.3 | 54.35 |
| chr1: 33938120-33938270 | ZSCAN20 | 56.99 |